Me again asking the silly questions - this might belong here as I've been told it may belong in a software section somewhere..? Which I have still been unable to find.
Here is a screenshot of my data:
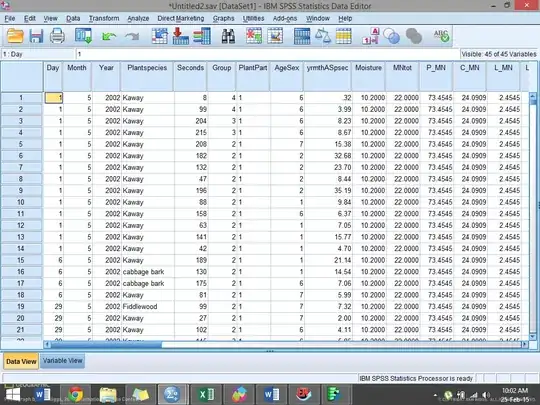
Thanks to an awesome answer to my last question I was able to calculate the variable I wanted - which is labeled YrmthASpsec (in screenshot). This is the percentage of time spent in each feeding event on a monthly basis (year>month) by age-sex category.
No what I would like to do is compare this via ANOVA - however I am having much troubles.
I would like to compare the mean percentage on a monthly basis for each age-sex category by plant part. So... compare mean % of time of fruit consumption (number 1) between age-sex classes for April 2002 for example.
I have fiddled with this for a while but with no success.
Need more info? Just ask :)
EDIT1
I am seeking to determine whether there is a significant difference in dietary composition between age-sex categories. Furthermore I am also looking at nutritional composition (macro) so protein, lip and sugar across age-sex classes.
So looking for the best way to do that using the data presented above. Most sources I have consulted use time as a proportion as it indicates importance/investment in a food item.