21

I observe a very weird behaviour in the SVD outcome of random data, which I can reproduce in both Matlab and R. It looks like some numerical issue in the LAPACK library; is it?

I draw $n=1000$ samples from the $k=2$ dimensional Gaussian with zero mean and identity covariance: $X\sim \mathcal N (0, \mathbf I)$. I assemble them in a $1000 \times 2$ data matrix $\mathbf X$. (I can optionally center $\mathbf X$ or not, it does not influence the following.) Then I perform singular value decomposition (SVD) to get $\mathbf X=\mathbf{USV}^\top$. Let's take some two particular elements of $\mathbf U$, e.g. $U_{11}$ and $U_{22}$, and ask what is the correlation between them across different draws of $\mathbf X$. I would expect that if the number $N_\mathrm{rep}$ of draws is reasonably big, then all such correlations should be around zero (i.e. population correlations should be zero, and sample correlations will be small).

However, I observe some weirdly strong correlations (around $\pm0.2$) between $U_{11}$, $U_{12}$, $U_{21}$, and $U_{22}$, and only between these elements. All other pairs of elements have correlations around zero, as expected. Here is how the correlation matrix for the $20$ "upper" elements of $\mathbf U$ looks like (first $10$ elements of the first column, then the first $10$ elements of the second column):

SVD weird correlations

Notice strangely high values in the upper-left corners of each quadrant.

It was this @whuber's comment that brought this effect to my attention. @whuber argued that the PC1 and PC2 are not independent and presented this strong correlation as an evidence for that. However, my impression is that he accidentally discovered a numerical bug in LAPACK library. What is going on here?

Here is @whuber's R code:

stat <- function(x) {u <- svd(x)$u; c(u[1,1], u[2, 2])};
Sigma <- matrix(c(1,0,0,1), 2);
sim <- t(replicate(1e3, stat(MASS::mvrnorm(10, c(0,0), Sigma))));
cor.test(sim[,1], sim[,2]);

Here is my Matlab code:

clear all
rng(7)

n = 1000;     %// Number of variables
k = 2;        %// Number of observations
Nrep = 1000;  %// Number of iterations (draws)

for rep = 1:Nrep
    X = randn(n,k);
    %// X = bsxfun(@minus, X, mean(X));
    [U,S,V] = svd(X,0);

    t(rep,:) = [U(1:10,1)' U(1:10,2)'];
end

figure
imagesc(corr(t), [-.5 .5])
axis square
hold on
plot(xlim, [10.5 10.5], 'k')
plot([10.5 10.5], ylim, 'k')
amoeba
  • 93,463
  • 28
  • 275
  • 317

3 Answers3

23

This is not a bug.

As we have explored (extensively) in the comments, there are two things happening. The first is that the columns of $U$ are constrained to meet the SVD requirements: each must have unit length and be orthogonal to all the others. Viewing $U$ as a random variable created from a random matrix $X$ via a particular SVD algorithm, we thereby note that these $k(k+1)/2$ functionally independent constraints create statistical dependencies among the columns of $U$.

These dependencies might be revealed to a greater or lesser extent by studying the correlations among the components of $U$, but a second phenomenon emerges: the SVD solution is not unique. At a minimum, each column of $U$ can be independently negated, giving at least $2^k$ distinct solutions with $k$ columns. Strong correlations (exceeding $1/2$) can be induced by changing the signs of the columns appropriately. (One way to do this is given in my first comment to Amoeba's answer in this thread: I force all the $u_{ii},i=1,\ldots, k$ to have the same sign, making them all negative or all positive with equal probability.) On the other hand, all correlations can be made to vanish by choosing the signs randomly, independently, with equal probabilities. (I give an example below in the "Edit" section.)

With care, we can partially discern both these phenomena when reading scatterplot matrices of the components of $U$. Certain characteristics--such as the appearance of points nearly uniformly distributed within well-defined circular regions--belie a lack of independence. Others, such as scatterplots showing clear nonzero correlations, obviously depend on choices made in the algorithm--but such choices are possible only because of the lack of independence in the first place.

The ultimate test of a decomposition algorithm like SVD (or Cholesky, LR, LU, etc.) is whether it does what it claims. In this circumstance it suffices to check that when SVD returns the triple of matrices $(U, D, V)$, that $X$ is recovered, up to anticipated floating point error, by the product $UDV^\prime$; that the columns of $U$ and of $V$ are orthonormal; and that $D$ is diagonal, its diagonal elements are non-negative, and are arranged in descending order. I have applied such tests to the svd algorithm in R and have never found it to be in error. Although that is no assurance it is perfectly correct, such experience--which I believe is shared by a great many people--suggests that any bug would require some extraordinary kind of input in order to be manifest.

What follows is a more detailed analysis of specific points raised in the question.


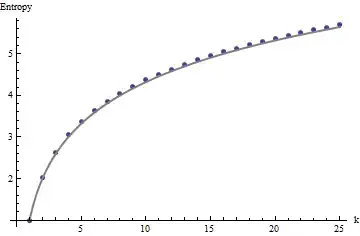
Using R's svd procedure, first you can check that as $k$ increases, the correlations among the coefficients of $U$ grow weaker, but they are still nonzero. If you simply were to perform a larger simulation, you would find they are significant. (When $k=3$, 50000 iterations ought to suffice.) Contrary to the assertion in the question, the correlations do not "disappear entirely."

Second, a better way to study this phenomenon is to go back to the basic question of independence of the coefficients. Although the correlations tend to be near zero in most cases, the lack of independence is clearly evident. This is made most apparent by studying the full multivariate distribution of the coefficients of $U$. The nature of the distribution emerges even in small simulations in which the nonzero correlations cannot (yet) be detected. For instance, examine a scatterplot matrix of the coefficients. To make this practicable, I set the size of each simulated dataset to $4$ and kept $k=2$, thereby drawing $1000$ realizations of the $4\times 2$ matrix $U$, creating a $1000\times 8$ matrix. Here is its full scatterplot matrix, with the variables listed by their positions within $U$:

Figure

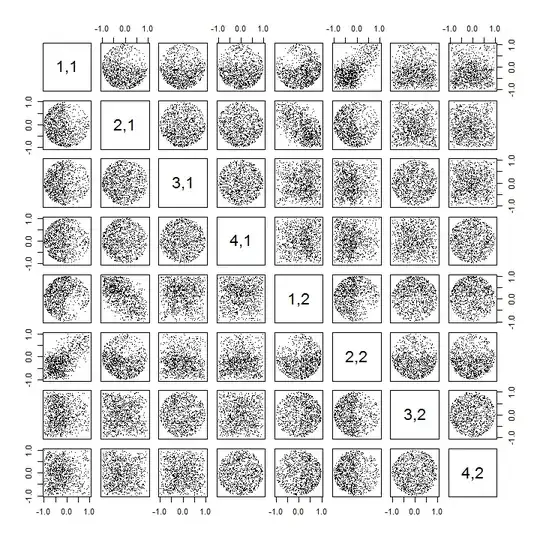
Scanning down the first column reveals an interesting lack of independence between $u_{11}$ and the other $u_{ij}$: look at how the upper quadrant of the scatterplot with $u_{21}$ is nearly vacant, for instance; or examine the elliptical upward-sloping cloud describing the $(u_{11}, u_{22})$ relationship and the downward-sloping cloud for the $(u_{21}, u_{12})$ pair. A close look reveals a clear lack of independence among almost all of these coefficients: very few of them look remotely independent, even though most of them exhibit near-zero correlation.

(NB: Most of the circular clouds are projections from a hypersphere created by the normalization condition forcing the sum of squares of all components of each column to be unity.)

Scatterplot matrices with $k=3$ and $k=4$ exhibit similar patterns: these phenomena are not confined to $k=2$, nor do they depend on the size of each simulated dataset: they just get more difficult to generate and examine.

The explanations for these patterns go to the algorithm used to obtain $U$ in the singular value decomposition, but we know such patterns of non-independence must exist by the very defining properties of $U$: since each successive column is (geometrically) orthogonal to the preceding ones, these orthogonality conditions impose functional dependencies among the coefficients, which thereby translate to statistical dependencies among the corresponding random variables.


Edit

In response to comments, it may be worth remarking on the extent to which these dependence phenomena reflect the underlying algorithm (to compute an SVD) and how much they are inherent in the nature of the process.

The specific patterns of correlations among coefficients depend a great deal on arbitrary choices made by the SVD algorithm, because the solution is not unique: the columns of $U$ may always independently be multiplied by $-1$ or $1$. There is no intrinsic way to choose the sign. Thus, when two SVD algorithms make different (arbitrary or perhaps even random) choices of sign, they can result in different patterns of scatterplots of the $(u_{ij}, u_{i^\prime j^\prime})$ values. If you would like to see this, replace the stat function in the code below by

stat <- function(x) {
  i <- sample.int(dim(x)[1]) # Make a random permutation of the rows of x
  u <- svd(x[i, ])$u         # Perform SVD
  as.vector(u[order(i), ])   # Unpermute the rows of u
}

This first randomly re-orders the observations x, performs SVD, then applies the inverse ordering to u to match the original observation sequence. Because the effect is to form mixtures of reflected and rotated versions of the original scatterplots, the scatterplots in the matrix will look much more uniform. All sample correlations will be extremely close to zero (by construction: the underlying correlations are exactly zero). Nevertheless, the lack of independence will still be obvious (in the uniform circular shapes that appear, particularly between $u_{i,j}$ and $u_{i,j^\prime}$).

The lack of data in some quadrants of some of the original scatterplots (shown in the figure above) arises from how the R SVD algorithm selects signs for the columns.

Nothing changes about the conclusions. Because the second column of $U$ is orthogonal to the first, it (considered as a multivariate random variable) is dependent on the first (also considered as a multivariate random variable). You cannot have all the components of one column be independent of all the components of the other; all you can do is to look at the data in ways that obscure the dependencies--but the dependence will persist.


Here is updated R code to handle the cases $k\gt 2$ and draw a portion of the scatterplot matrix.

k <- 2    # Number of variables
p <- 4    # Number of observations
n <- 1e3  # Number of iterations
stat <- function(x) as.vector(svd(x)$u)
Sigma <- diag(1, k, k); Mu <- rep(0, k)
set.seed(17)
sim <- t(replicate(n, stat(MASS::mvrnorm(p, Mu, Sigma))))
colnames(sim) <- as.vector(outer(1:p, 1:k, function(i,j) paste0(i,",",j)))
pairs(sim[, 1:min(11, p*k)], pch=".")
whuber
  • 281,159
  • 54
  • 637
  • 1,101
  • Hi, @whuber. I am happy to continue this discussion; unfortunately, I have to run right now, so will only be able to reply later today. However, if you think the phenomenon is not a bug, I would like to ask you how it is possible that there is high correlation (in my code) between $U_{11}$ and $U_{22}$, but almost no correlation between $U_{11}$ and $U_{23}$ (or any other $U_{2i}$ with $i>2$)? As you realize, the rows of $X$ are simply independent draws of a 2D Gaussian. What *on Earth* could possibly make 1st data point be [co]related with the second point, but not with the third, etc.?! – amoeba Feb 24 '15 at 17:01
  • I should add (just to be completely clear about the nature of the problem) that one can always randomly permute rows of $X$ before doing SVD, but there is still correlation between *first two points*. I am currently convinced that it *must* be a numerical problem (perhaps for some reason SVD does not fully converge). – amoeba Feb 24 '15 at 17:03
  • 3
    The correlation occurs between the first components of the columns of $U$ because that's how the SVD algorithm works. That the rows of $X$ are Gaussian is immaterial: I'm sure you've noticed that the coefficients of $U$ are *not* Gaussian. – whuber Feb 24 '15 at 17:05
  • 2
    By the way, I have just discovered that simply replacing `svd(X,0)` by `svds(X)` in my Matlab code makes the effect disappear! As far as I know, these two functions use different SVD algorithms (both are LAPACK routines, but apparently different ones). I don't know if R has a function similar to Matlab's `svds`, but I am wondering if you are *still* going to maintain that it is a "real" effect and not a numerical issue. – amoeba Feb 24 '15 at 17:21
  • 1
    I reproduced whuber's experiment in SPSS and got quite similar looking matrix of scatterplots (except that I got no elongated shapes such as [1,1;2,2]). If you want to play crisscross game, do the same scatterplots for elements of `V` (not U) vectors. – ttnphns Feb 24 '15 at 18:03
  • @amoeba I have been as clear as possible that the *details* depend on the algorithm, but that the *fact of the dependence* among the columns of $U$ is fundamental and, I think, not validly deniable. I exited our previous conversation at the point [you denied $U$ could be considered a random variable](http://stats.stackexchange.com/questions/138204/are-pca-components-of-multivariate-gaussian-data-statistically-independent?noredirect=1#comment264218_138204), because it was then apparent I was unable to communicate these ideas in the standard language of statistics and mathematics. – whuber Feb 24 '15 at 18:08
  • 1
    @amoeba, I took the liberty to re-do whuber's simulation in SPSS with 100 thousand samples. There were correlations between elements (the largest was `.175`). I also repeated the whole thing now with component scores `US` rather than left vectots `U`. And there were correlations, the largest `.137` - it was observed between scores in cells (1,2) and (3,1). – ttnphns Feb 24 '15 at 18:53
  • 4
    Gentlemen, wait a minute. Why are you not speaking of the sign? Sign of an eigenvector is basically arbitrary. But the program of svd doesn't assign it randomly, the sign is dependent on the implementation of svd and on data. If, after extracting `U` you decide randomly whether each of its columns is to remain as is or is to change its sign, won't then the correlations you are talking about vanish? – ttnphns Feb 24 '15 at 19:30
  • 2
    @ttnphns That is correct, as explained in my edit. Although that makes the correlations vanish, the *dependencies* among the columns of $U$ do not thereby go away. (The enhanced version of `stat` I supplied is equivalent to randomly changing the signs of the columns.) – whuber Feb 24 '15 at 19:32
  • @whuber, I probably was soon: I haven't read your edits of the answer. – ttnphns Feb 24 '15 at 19:33
  • Whuber, this is not fair; in the comment you linked to I did not deny that $U$ could be considered a random variable. Of course I agree that in the context of this thread $U$ is a random variable! Moreover, I fully agree that (under this interpretation) elements of $U$ are not independent. My question, however, was very specifically about how it is possible to get **high** correlations of around 0.2 with large $n$ or around 1000. I posted a separate answer as a reply to yours. – amoeba Feb 24 '15 at 21:31
  • 1
    @ttnphns: SSPS, R, and Matlab, all use LAPACK libraries, so reproducing these results in another language, unfortunately is not an independent verification. However, your idea about the signs is ingenious! I made a quick simulation in Matlab, and indeed all the correlations vanish! It perfectly answers my question. Could you please post it as a separate answer, which I will be happy to accept? Of course, whuber is correct that the elements of U are not statistically independent)! But this was not my question here. My question was about the appearance of high correlations. – amoeba Feb 24 '15 at 21:41
  • A hint for the debators: try also [Brownian correlation](http://en.wikipedia.org/wiki/Distance_correlation) in place or Pearson. – ttnphns Feb 24 '15 at 22:01
  • 2
    A minor point (to this great thread!) The SVD does not necessitates that the elements in the diagonal of `S` are in a particular order; it is a matter of convenience. Other routines guarantee this (eg. MATLAB's `svds`) but that is not a general requirement. @amoeba: Looking at `svds` (which seems free from this problematic behaviour) the computation is based on actually computing the eigenvalues first (so it does not use the standard `dgesdd`/`dgesvd` LAPACK routines - I strongly suspect it uses `dsyevr`/`dsyevx` at first). – usεr11852 Feb 25 '15 at 04:13
  • `that the columns of U and the rows of V are orthonormal`. Maybe you meant "that the columns of U and the columns of V are orthonormal"? – ttnphns Feb 25 '15 at 06:23
  • @ttnphns That would be conventional--and is what I intended--but it is no error: orthonormality of $V$ is equivalent to orthonormality of $V^\prime$. – whuber Feb 25 '15 at 18:02
  • 1
    Whuber, I have earlier taken the liberty to edit your answer to replace "rows" by "columns", as @ttnphns suggested; I thought it was a typo (I thought you would get an automatic notification, but perhaps you didn't). You can roll back if you want. Notice that orthonormality of columns of $V$ implies orthonormality of its rows only if $V$ is square. If $n – amoeba Feb 25 '15 at 22:39
  • 1
    @amoeba I did get the notification and accepted the edit, because it exactly reflected my original intentions: thank you. Your remarks about dropping columns indicate we have both been a little negligent by not specifying exactly what we mean by SVD (are the eigenvalues ordered or not? are columns corresponding to zero eigenvalues dropped or retained?), but I don't think any harm has been done thereby. – whuber Feb 25 '15 at 22:43
  • I still don't understand what you meant by saying that "such choices are possible only because of the lack of independence in the first place" (as we briefly discussed in the comments to my answer), but apart from this small bit I am fully happy with your answer and now that this whole issue has been clarified, +1 and I accept it now. Cheers! – amoeba Mar 03 '15 at 23:24
  • I realized my thinking on that point was fuzzy, so I'm still mulling it over. If I don't totally forget about this issue in all the distractions at work, I'll try to get back to it at some future time, even if it's only to confirm that I was being muddle-headed. – whuber Mar 03 '15 at 23:44
11

This answer presents a replication of @whuber's results in Matlab, and also a direct demonstration that the correlations are an "artifact" of how the SVD implementation chooses sign for components.

Given the long chain of potentially confusing comments, I want to stress for the future readers that I fully agree with the following:

  1. In the context of this discussion, $\mathbf U$ certainly is a random variable.
  2. Columns of $\mathbf U$ have to be of length $1$. This means that the elements inside each column are not independent; their squares sum to one. However, this does not imply any correlation between $U_{i1}$ and $U_{j1}$ for $i\ne j$, and the sample correlation should be tiny for large number $N_\mathrm{rep}$ of random draws.
  3. Columns of $\mathbf U$ have to be orthogonal. This means that the elements from different columns are not independent; their dot product is zero. Again, this does not imply any correlation between $U_{i1}$ and $U_{j2}$, and the sample correlation should be tiny.

My question was: why do we see high correlations of $\sim 0.2$ even the for large number of random draws $N_\mathrm{rep}=1000$?

Here is a replication of @whuber's example with $n=4$, $k=2$, and $N_\mathrm{rep}=1000$ in Matlab:

SVD

On the left is the correlation matrix, on the right -- scatter plots similar to @whuber's. The agreement between our simulations seems perfect.

Now, following an ingenious suggestion by @ttnphns, I assign random signs to the columns of $U$, i.e. after this line:

[U,S,V] = svd(X,0);

I add the following two lines:

U(:,1) = U(:,1) * sign(randn(1));
U(:,2) = U(:,2) * sign(randn(1));

Here is the outcome:

SVD with random signs

All the correlations vanish, exactly as I expected from the beginning!

As @whuber says, the lack of independence can be seen in the perfect circular shape of some scatter plots (because the length of each column must equal $1$, sum of squares of any two elements cannot exceed $1$). But the correlations do vanish.

Summarizing the whole issue, we see that strong correlations appear because LAPACK chooses signs for columns of $\mathbf U$ in a specific way that seems to depend on the first two data points. It is certainly not a bug because the decomposition is correct. But LAPACK essentially creates these "artifact" correlations by exploiting the freedom to assign signs. These correlations do not reflect the dependence of the elements of $\mathbf U$; instead, they reflect the freedom in the SVD solution and a particular LAPACK's convention to fix it.

PS. Congratulations to @whuber for passing 100k reputation today!

amoeba
  • 93,463
  • 28
  • 275
  • 317
  • If you want to see "high" correlations, use this version of SVD in place of `stat` in my code: `stat – whuber Feb 24 '15 at 21:47
  • I have just finished editing this answer, @whuber; I replaced `svds` by `svd` followed by a random sign choice for the columns of $U$. I agree with you: the high correlations were **entirely** due to the sign choice, as hypothesized by ttnphns. This provides a satisfactory answer to my question. Now, let's try to settle the disagreements! I agreed that the elements of $U$ are random variables and that they are not independent. Would you agree that the figure in your answer was super-misleading and that using correlations of 0.2 as an argument in our previous debate was wrong? – amoeba Feb 24 '15 at 21:56
  • I would not agree with that: the figure accurately shows the results of the default settings of SVD in `R`. I provided explanations for that behavior that are grounded in the algorithm and underlying theory. If any aspect of that is "super-misleading" I will, of course, strive to correct or clarify the problem, but at this point I am not aware of a specific problem to fix. You might be interested to note that the modified version provided in my previous comment to this question is capable of producing correlations around $\pm 2/3$, quite high indeed: there's nothing special about your $0.2$. – whuber Feb 24 '15 at 22:00
  • You used a simulation producing a correlation of $0.2$ as an argument that these elements are not independent (with which I agree: they are not). However, the correlation is $0.2$ only because of the special sign choice made by the SVD function (that presumably looks at the first data points to fix the sign!). Therefore this cannot be an evidence of non-independence, and your argument was wrong; do you agree? It's like generating two random numbers from a standard normal, *making their sign equal*, observing the correlation, and concluding that two Gaussian draws are not independent. – amoeba Feb 24 '15 at 22:12
  • [cont.] The figure is misleading for the same reason. Okay, the figure is actually very interesting because, as you say, it illustrates the default setting of SVD in LAPACK, but the surrounding text ("interesting lack of independence" etc.) is misleading. This independence seems to be *created* by the LAPACK SVD implementation by the special sign choice. – amoeba Feb 24 '15 at 22:15
  • The random columns are i.i.d., generated independently. So, values (i,1) and (j,2) are statistically independed. If we perform an arbitrary orthogonal rotation of the data, will (i,1) and (j,2) be still independent? If we perform not arbitrary rotation, such as PCA, will they be independent? In what definition of "(in)dependent"? – ttnphns Feb 24 '15 at 22:22
  • 1
    @ttnphns: whuber's main point is that the elements of $U$ are not independent. The elements inside one column are not independent because their squares **must** sum to one. The elements of different columns are not independent, because the columns **must** have a zero dot product. So if you know all elements of the first column apart from the last one, you can compute it; if you further know all the elements of the second column apart from the last two, you can compute those. This means, be definition, that they are not independent. – amoeba Feb 24 '15 at 22:28
  • 1
    Intuitively, that's fair. As soon as the first principal axis is defined in space the rest pr. axes get reduced freedom. In case of 2D data the second (last) PC is tied entirely, except the sign. I'd rather call it constraint, not dependence in statistical sense. – ttnphns Feb 24 '15 at 22:51
  • @ttnphns A constraint forces dependence. It is a particularly *strong* form of dependence because (under mild assumptions which do apply here) it causes the tuple of variables to lie in a proper submanifold of the sample space. For SVD, the space of $n\times k$ matrices has $nk$ real dimensions, but the possible values of $U$ form a manifold of codimension $k(k+1)/2$. This could be difficult to detect merely by studying correlations among components in some basis: these correlations have an arbitrary aspect to them, as amoeba has discovered. That makes the dependence no less real. – whuber Feb 24 '15 at 23:18
  • @amoeba I feel obliged to point out that the "perfectly circular shape of the scatterplots" is strong evidence of *lack* of independence, rather than independence! Independence means the conditional distributions (say, the vertical ones) are all the same. When the data are limited to a circle and the $x$ coordinate is near one extreme, the $y$ coordinate must be close to zero--and is *constrained* from being large in magnitude. This proves the conditional distributions of variables are not independent. This confusion seems to be the basis of your "super-misleading" charge. – whuber Feb 24 '15 at 23:30
  • @whuber, thanks, that was a typo, and I am sad that you did not guess so. I fixed it. – amoeba Feb 24 '15 at 23:32
  • That might advance the conversation. The next step is to appreciate the logic of the argument. As I just explained in a comment, the key issue is not whether there is correlation or lack thereof. Originally, correlation entered the discussion only as a way to establish lack of independence in a convincing way. By randomizing the signs of the columns, you wash away such evidence *but without overcoming the functional dependence among the columns.* Your statement "if the data are multivariate Gaussian, then principal components are indeed independent" remains as erroneous as ever. – whuber Feb 24 '15 at 23:42
  • @whuber: I thought I made it clear long time ago that I fully agree with your statement that the elements of $U$ are not statistically independent, even for the multivariate Gaussian data. I repeat it here again, to be absolutely clear about that. **There is no discussion about that!** I still think that my quoted statement is correct, but it is *because I mean something else by it*; I am not referring to the dependence or independence of the elements of $U$. Please allow me to edit my answer in the other thread before continuing; I will strive to make it as clear as possible. – amoeba Feb 24 '15 at 23:50
  • @whuber: [cont.] But for the purposes of the discussion in *this thread*, it is only important that the correlations cannot be used as an evidence of this dependence; they are an *unfortunate artifact* of how SVD function chooses signs of components. Your answer here starts with the figure sporting these high correlations and you point at the elliptical scatter plots as illustrating "an interesting lack of independence". I do believe this is very misleading, yes. This particular "lack of independence" is arbitrarily enforced by the particular SVD implementation. – amoeba Feb 24 '15 at 23:59
  • I don't think we differ much about that. It sounds more like a matter of emphasis, especially as our understanding of the situation evolves. What would be nice to know is whether we should be studying *a particular SVD implementation* (which would seem to be the thrust of your claims of a "bug" in LAPACK) or looking at something more general. If you feel free to reassign signs to columns--as I do as well--then your references to "weirdly strong correlations" appear to be irrelevant. I confess to being confused about what you are really asking. – whuber Feb 25 '15 at 00:04
  • @whuber: My original question was why we see strong correlations even though they should all be around zero (the elements of $U$ are dependent, yes, but correlations between them should be zero). The answer to this question is by now clear: strong correlations appear because LAPACK chooses signs for columns of $U$ in a specific way that seems to depend on the first two data points. This resolves the issue; it is certainly not a "bug" because the decomposition is correct. But LAPACK essentially creates these "artifact" correlations by exploiting the freedom to assign signs. – amoeba Feb 25 '15 at 00:28
  • @whuber: [cont]. My trouble with your answer is that you repeatedly state that the correlations reflect the dependence (the constraints), whereas they actually reflect the "freedom" in the solution and a particular convention to fix it. This freedom is rather opposite of constraints... If you could edit your answer to make this more clear, I will be happy to accept it. Actually, after re-reading your answer right now, I see that you cover almost all of that in your "Edit". So I guess most of my complaints are about the formulations in the first part of your answer, before the Edit. – amoeba Feb 25 '15 at 00:29
  • At the risk of introducing some redundancies, I have attempted to summarize the key points in new introductory paragraphs to my answer, as clearly and dispassionately as I can manage. I harbor no expectation that this resolves everything, but hope that it might bring attention to the more prominent and interesting ideas we have discussed. I trust you will *not* accept it as a resolution to your question until you are completely satisfied. – whuber Feb 25 '15 at 00:58
  • Thanks, @whuber, I find your new introductory paragraphs very clear and summarizing the issue well. I appreciate the update. One quibble (or perhaps still a confusion?) is with your remark in italics that "such [sign] choices are possible only because of the lack of independence in the first place". Can you explain why? How is the freedom to choose column signs related to the constraints on the elements of $U$ that lead to dependence? – amoeba Feb 25 '15 at 01:09
  • That is a great comment; it is exactly the one I feared when I wrote that statement :-). I'm afraid an adequate explanation of what I was trying to say would be difficult for me to present briefly in any elementary way. The idea lurking here is that we can view SVD in different ways. As a practical matter, it produces the tuple $(U,D,V)$. Conceptually, though, it produces *equivalence classes* of such tuples under the action of a group of transformations and we don't really care which element of the group is applied. This creates two slightly different meanings of "independence." – whuber Feb 25 '15 at 01:16
  • @whuber, I think I don't have any problem understanding what you mean when you talk about the equivalence class of SVD solutions; for any given $X$ the tuple $(U,S,V)$ is not unique due to to (a) arbitrary column signs and (b) arbitrary order of columns. This induces equivalence classes in the space of such tuples. This is clear. However, I still don't understand why you say that "such choices [i.e. non-uniquenesses of an SVD solution] are possible only because of the lack of independence in the first place". What is the connection between constraints on $U$ and non-uniqueness of $U$? – amoeba Feb 25 '15 at 13:33
0

Check the norm of your singular vectors U and V, it's 1 by definition. You don't need to go through SVD to get the same exact matrix you plot by simply generating two random variables $x$ and $y$ with the constraint that the sum of their squares is 1: $$x^2+y^2=1$$

Assume that the means are zero, then $$Cov[x,y]=Var[xy]=E[x^2y^2]-E[xy]^2$$

This will not be equal to zero. You can plug the standard normal into $x$ and $y$ to see what's the value of covariance to be expected here.

Aksakal
  • 55,939
  • 5
  • 90
  • 176
  • Although this observation is pertinent, it addresses only interdependencies among the individual components of each column (and as such is included within the $k(k+1)/2$ independent constraints on $U$). The question that got all this started concerned dependencies between *different* columns of $U$: that's why so little attention has been paid to correlations within each column. Another (perhaps fruitful) way to look at this is to roll $D$ into $U$ and analyze the columns of $UD$, which are no longer normalized, but are still subject to $k(k-1)/2$ constraints. – whuber Feb 25 '15 at 15:41
  • It's the columns of $U$ that have length $1$, not the rows (in case when $U$ is not square, but has $n$ rows and $k$ columns with $n>k$). The columns of $U$ have $n$ elements, and we have been discussing two particular cases in this thread: in my question I suggested to consider $n=1000$, and in his answer @whuber chose to consider $n=4$. Your example with $x^2+y^2=1$ includes only two random variables, so it does not fit to the rest of the discussion here. If you could make a statement about what should be the correlation between two elements of one column of $U$, that would be interesting. – amoeba Feb 25 '15 at 15:51
  • @Amoeba We can make Asksakal's example pertinent either by taking $x$ to be the first component of a column of $U$ and $y$ to be the norm of the remaining components or by extending the example inductively to more variables. Unfortunately, **the conclusion is incorrect:** it is perfectly possible for $x^2+y^2=1$, each with zero mean, yet for $\text{Cov}(x,y)=0$. Take, for instance, $x=\cos(\theta)$ and $y=\sin(\theta)$ for $\theta$ uniformly distributed on $[0,2\pi)$. – whuber Feb 25 '15 at 15:57
  • @whuber, yes, I agree. The mistake in Aksakal's argument is that individual elements of $U$ are definitely not standard normal! If the sign of each column is randomized, then (in my simulation) the mean of each $U_{ij}$ is around $0$ and the variance is around $1/n$, which makes total sense -- add up $n$ variances in one column and you will get $n \cdot 1/n = 1$, as required by the constraint. This is assuming the elements are uncorrelateed, which they seem to be. – amoeba Feb 25 '15 at 16:00
  • Actually, I don't understand why OP expects that $U_{11}$ and $U_{22}$ should be independent. – Aksakal Feb 25 '15 at 16:00
  • I never said anything about $U_{11}$ and $U_{22}$ being independent (at least not in this thread). – amoeba Feb 25 '15 at 16:02
  • @amoeba, Ok, correlated. Why do you expect them to be uncorrelated? U and V matrices are formed by some kind of linear combination of X matrix elements. So, this must bring in some correlation due to the cross-terms – Aksakal Feb 25 '15 at 16:06
  • The $U$ and $V$ matrices are *nonlinear* functions of $X$. If they were linear, their components would be Normally distributed, but that is obviously inconsistent with the fact the components are bounded by $\pm 1$. – whuber Feb 25 '15 at 16:08
  • It doesn't change my argument. The vectors are functions of X. There's no obvious reason for them to have uncorrelated elements. – Aksakal Feb 25 '15 at 16:12
  • 1
    @Aksakal, I invite you to run a simulation and see for yourself that they are indeed uncorrelated; just be sure to randomize the sign of each column of $U$ on each iteration. If you want an intuitive proof, observe that there is nothing "special" about any particular row of $X$, meaning that if correlation between $U_{11}$ and $U_{21}$ is $\rho$, then it must be the same for any other pair. So we have $n$ random variables with correlation matrix having all off-diagonal elements equal to $\rho$. Now, is $\rho$ positive or negative? The problem doesn't seem to offer a choice, hence $\rho=0$. – amoeba Feb 25 '15 at 16:14