0

I have a cross-section of 100,000 individuals and information on their age. I suspect that there may be clustering by age or that the sample exhibits behavior that there would be two groups, the old and the young.

Is there a statistical test that tells me the location of the cut-off?

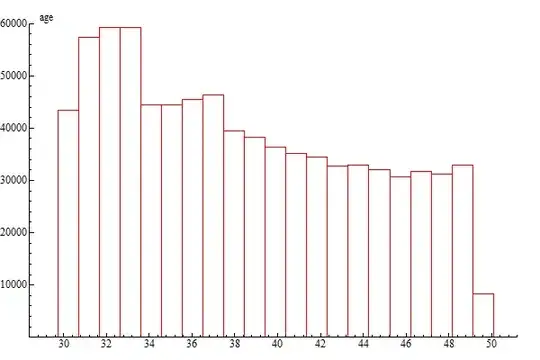
Looking at a histogram, I can eyeball it which occurs at 32 (not 42 incidentally..). But is there a way to test this?

Thanks so much!

Better Plot

Hirek
  • 827
  • 2
  • 10
  • 18
  • 1
    This sounds as if you are asking whether an anti-mode (a local minimum in the density function) is genuine. (I wouldn't use the term cut-off and I don't see what this has to do with the variance.) There are at least three approaches, paralleling similar questions for modes: postulate a model for the distribution as a whole and fit it; see if apparent facts about the data are persistent under resampling; check how the estimated density function changes with different degrees of smoothing. – Nick Cox Feb 23 '15 at 22:20
  • 1
    http://stats.stackexchange.com/questions/138223/how-to-test-if-my-distribution-is-multimodal and similar threads may suggest ideas. – Nick Cox Feb 23 '15 at 22:21
  • 2
    The title of the post does not correspond to the content... – Richard Hardy Feb 24 '15 at 08:45
  • More elementary than any of the suggestions I made earlier is to be clear that what you think are identifying is not an artifact of bin origin and width on a histogram. – Nick Cox Feb 24 '15 at 09:24
  • @NickCox Thanks so much Nick! The first approach as you say would be to postulate a distribution and do a KS test with the fitted values? And for the last suggestion, would the strategy be to over-smooth and see if the peak at 32 is robust to that? – Hirek Feb 24 '15 at 10:40
  • I wouldn't recommend a K-S test here for several reasons, one being that the parameters are already estimated from the data. The problem is just akin to fitting any specified distribution and it's usually best phrased in terms of whether a particular distribution fits better than other plausible candidates. But it's your problem not mine; with 100,000 data points most hypothesis testing is futile in my view. – Nick Cox Feb 24 '15 at 10:43
  • Looking now at your additions: The density estimate here really doesn't help: it is mostly just a subdued echo of the discreteness in the data. Evidently only integer years are reported; that's unsurprising, but even the histogram gets that slightly wrong as (1) the gaps between bars aren't equal (2) conventionally there shouldn't be gaps at all. I think you would learn enormously more by establishing how the sample was put together (evidently only ages from 30 to 50) than from any formal examination of the distribution. – Nick Cox Feb 24 '15 at 10:48
  • 1
    If your ages run from 30 to 50, then describing those in their 40s as "old" is a poor choice of words, and possibly even insensitive or offensive, although I presume entirely by accident. – Nick Cox Feb 24 '15 at 10:49
  • A minute taste issue, but the number of ticks on both axes is absurd: having more ticks than possible data values is some kind of record possibly. – Nick Cox Feb 24 '15 at 10:52
  • 1
    Your histogram is badly screwed up. You only have integer age, right? Make each bar width 1, and integer. The gap that you are seeing is due to your bad visualization. There is a drop-off between 33 and 34, but I doubt it is statisticall significant by any measure. **I'd say there are *no* clusters in this chart**. – Has QUIT--Anony-Mousse Feb 24 '15 at 11:12
  • Thank you @Anony-Mousse I assume the simple frequency plot is a better way to learn about the data, right? The data was put together from the 1980 census. It is available here http://economics.mit.edu/faculty/angrist/data1/data/angkru1991 under qob.rar. The data set is quite famous actually. – Hirek Feb 24 '15 at 16:12
  • 1
    Yeah, but the age distribution of a population usually does not cluster well, unless a whole generation was killed in the war. – Has QUIT--Anony-Mousse Feb 24 '15 at 19:33
  • 1
    The revised histogram is now cleaner. I would advise deleting the density plot. A remaining small point is that bin heights averaging $\sim 30000$ don't tally with a report that there are in total $\sim 100000$ observations. My major reaction in relation to your question is that formal testing of modes or antimodes is moot without information on how the people were selected. – Nick Cox Feb 24 '15 at 19:55
  • @NickCox Thanks so much! I shall delete the density plot and you're right, it's 816435 observations in total. I misread by one digit. The data is a census and I have a state dummy as well. – Hirek Feb 24 '15 at 21:30

0 Answers0