First off, I don't know a lot of stats. That said, I am hoping you can help me derive the function to calculate the fitted probability from the summary of a logistic regression below:
My instinct is that the formula would be...
$$ P= 1/(1+e^{-z}) $$ Where
$z= B_0 + x_1B_1 + x_2B_2 + ... + X_pB_p$
where
$B_1 = ln(OR)$
However, the results I am getting from this formula do not seem to be correct. Here's why I think it is wrong or that I am making a mistake:
When I model the formula as written in my question above,
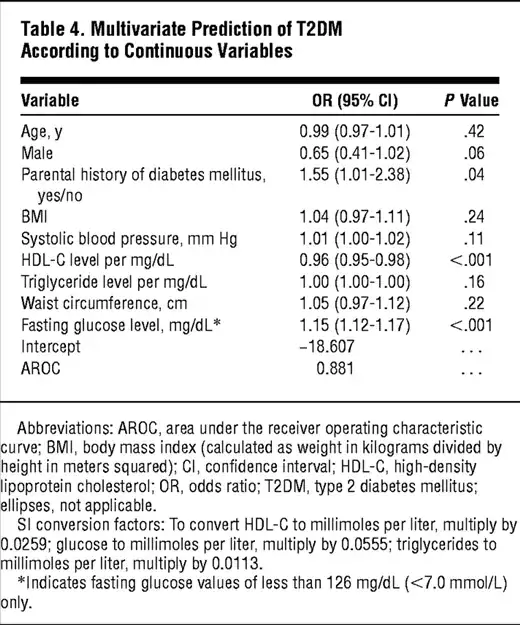
- I am getting an inverse correlation between age and diabetes risk, which is counter intuitive.
- When I compare the results between the continuous model (Table 4) and the model with discreet variables (Table 3), the results are pretty different.
- The only variable that seems to matter in the continuous model is fasting blood glucose. I know this is a strong indicator for diabetes, but what's the point of having the other variables if they barely affect the probability.
For example, from my model, I get the following results:
Example
Gender: Male Age: 34 BP: 145/95 BMI: 38.5 Waist Circ: 42 HDL-C: 45 Triglycerides: 100 Fasting glucose: 85 Diabetes History: N
I get the following results:
- (p) = 2.6% in discreet model (table 3)
- (p) = 23.5% in continuous model (table 4)
If I hold all the variables constant and only change the age from 34 to 45, I get the following results:
- In discreet model, (p) remains the same at 2.6%. This makes sense given that age is categorical.
- In continuous model, (p) = 18.5%
I am surprised that the probability is declining as we increase the age. Based on intuition and knowledge of the progression of diabetes, I would expect the opposite.
Am I doing something wrong?
The full study I am referencing is: http://archinte.jamanetwork.com/article.aspx?articleid=486842#ioi70028t4
If anyone could help me derive the probability of diabetes from this study using the continuous variable model, I would be very grateful!
Thank you in advance for your help.