I'm attempting to determine if store B is 'better' than store A. Let's say that the two stores are identical in every way except for the sales assistants. I'd like to determine if one store makes more money than the other.
The problem is a dearth of data. On any given day, for each store, I get the number of people who entered the store and the dollar amount purchased. That's it. The dollar amount purchased could represent multiple sales or a single purchase; I can't know the difference. Here is some data:
Day customers sales customers sales
Day 1   7    $-    9  $-
Day 2   25   $-    5  $-
Day 3   14   $-    13  $-
Day 4   8    $-    12  $-
Day 5   6    $-    17  $-
Day 6   20   $-    29  $-
Day 7   7    $-    27  $-
Day 8   30   $-    71  $-
Day 9   91   $-    141  $8.88
Day 10  30   $-    20  $-
Day 11  29   $-    10  $-
Day 12  136  $-    80  $-
Day 13  99   $3.96  132  $4.50
Day 14  116  $-    73  $-
Day 15  65   $17.84  60  $-
Day 16  95   $-    150  $-
Day 17  82   $-    115  $5.07
Day 18  172  $-    70  $1.88
Day 19  101  $5.21  195  $-
Day 20  190  $-    148  $-
Day 21  130  $-    162  $37.89
Day 22  92   $1.03  154  $4.01
Day 23  123  $-    97  $-
Day 24  158  $-    112  $-
Day 25  109  $-    128  $1.96
Day 26  206  $-    140  $-
Day 27  132  $-    134  $0.16
Day 28  180  $-    143  $1.77
Day 29  155  $-    129  $4.99
Day 30  80   $-    128  $5.86
Day 31  214  $-    156  $0.50
Day 32  392  $1.75  261  $-
Day 33  201  $-    132  $-
Day 34  225  $-    148  $3.24
Day 35  145  $-    204  $-
Day 36  126  $-    105  $
The 2nd and 3rd columns are customers and sales in Store A and the 4th and 5th columns are customers and sales in Store B.
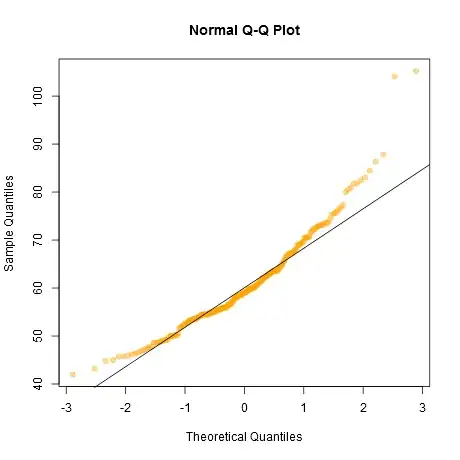
The earnings are not normally distributed, so I can't run a t-test. With a lot more data perhaps they would become normally distributed, or I could take averages of a much greater data set, but this is the data that I have to work with right now.
Store B, however, appears to have a much greater incidence of non-zero values, which is a binomial distribution, so perhaps I could show % of non-zero sales values. Store A produced sales 14% of the days and store B produced sales 36% of the days. Following Test if two binomial distributions are statistically different from each other I could calculate the test statistic and compare it to the critical region value, but unfortunately each day does not have the same number of customers. Basically I don't have the result of every individual trial (a customer enters a store) and the trails are irregularly grouped.
So how would I go about showing significance here?