-1

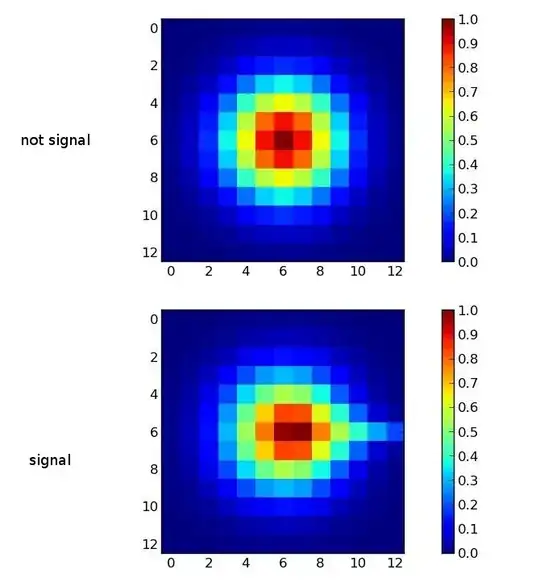
I want to find statistical criteria for signal registration (see pict). When I don't have a signal I registrate a simple gaussian two-dimenshial distribution. When I have a signal I have gaussian plus some "tail" (horizontal on the picture). Direction of a "tail" may differs, but I have some minimum length of a tail for a proper signal.

Top - we dont have signal. Bottom - we have a signal

I tried to use chi square criteria but faild. p-value for my signal was 1.0. What kind of a criteria can I use in this case?

There is a sample data:

A signal:

[[ 0.    0.    0.    0.01  0.01  0.01  0.02  0.01  0.01  0.01  0.    0.    0.  ]
 [ 0.    0.    0.01  0.02  0.03  0.05  0.05  0.05  0.03  0.02  0.01  0.    0.  ]
 [ 0.    0.01  0.02  0.05  0.09  0.13  0.14  0.13  0.09  0.05  0.02  0.01  0.  ]
 [ 0.01  0.02  0.05  0.11  0.2   0.27  0.31  0.28  0.2   0.11  0.05  0.02  0.01]
 [ 0.01  0.03  0.09  0.2   0.34  0.48  0.56  0.52  0.37  0.21  0.1   0.03  0.01]
 [ 0.01  0.05  0.13  0.27  0.48  0.69  0.84  0.83  0.62  0.4   0.22  0.08  0.03]
 [ 0.02  0.05  0.14  0.31  0.54  0.78  0.99  1.    0.77  0.56  0.4   0.29  0.19]
 [ 0.01  0.05  0.13  0.27  0.48  0.69  0.84  0.83  0.62  0.4   0.22  0.08  0.03]
 [ 0.01  0.03  0.09  0.2   0.34  0.48  0.56  0.52  0.37  0.21  0.1   0.03  0.01]
 [ 0.01  0.02  0.05  0.11  0.2   0.27  0.31  0.28  0.2   0.11  0.05  0.02  0.01]
 [ 0.    0.01  0.02  0.05  0.09  0.13  0.14  0.13  0.09  0.05  0.02  0.01  0.  ]
 [ 0.    0.    0.01  0.02  0.03  0.05  0.05  0.05  0.03  0.02  0.01  0.    0.  ]
 [ 0.    0.    0.    0.01  0.01  0.01  0.02  0.01  0.01  0.01  0.    0.    0.  ]]

Not a signal:

[[ 0.    0.    0.    0.01  0.01  0.02  0.02  0.02  0.01  0.01  0.    0.    0.  ]
 [ 0.    0.    0.01  0.02  0.04  0.06  0.06  0.06  0.04  0.02  0.01  0.    0.  ]
 [ 0.    0.01  0.03  0.06  0.11  0.15  0.17  0.15  0.11  0.06  0.03  0.01  0.  ]
 [ 0.01  0.02  0.06  0.14  0.24  0.33  0.37  0.33  0.24  0.14  0.06  0.02  0.01]
 [ 0.01  0.04  0.11  0.24  0.41  0.57  0.64  0.57  0.41  0.24  0.11  0.04  0.01]
 [ 0.02  0.06  0.15  0.33  0.57  0.8   0.9   0.8   0.57  0.33  0.15  0.06  0.02]
 [ 0.02  0.06  0.17  0.37  0.64  0.9   1.    0.9   0.64  0.37  0.17  0.06  0.02]
 [ 0.02  0.06  0.15  0.33  0.57  0.8   0.9   0.8   0.57  0.33  0.15  0.06  0.02]
 [ 0.01  0.04  0.11  0.24  0.41  0.57  0.64  0.57  0.41  0.24  0.11  0.04  0.01]
 [ 0.01  0.02  0.06  0.14  0.24  0.33  0.37  0.33  0.24  0.14  0.06  0.02  0.01]
 [ 0.    0.01  0.03  0.06  0.11  0.15  0.17  0.15  0.11  0.06  0.03  0.01  0.  ]
 [ 0.    0.    0.01  0.02  0.04  0.06  0.06  0.06  0.04  0.02  0.01  0.    0.  ]
 [ 0.    0.    0.    0.01  0.01  0.02  0.02  0.02  0.01  0.01  0.    0.    0.  ]]
  • I would consider using _mixture analysis_ for such task. Check [this answer](http://stats.stackexchange.com/a/129028/31372) of mine. – Aleksandr Blekh Jan 22 '15 at 06:09
  • I see. I need some time to pluge in it. – Mihail Kondratyev Jan 22 '15 at 06:38
  • Take your time. – Aleksandr Blekh Jan 22 '15 at 07:05
  • Am I right that I have to build a model of my "ideal" distribution? If so, the problem is that the direction of a "tail" of my distribution (mentioned avobe) may differ, and I don't see how I could invent an ideal model for this. Thanks. – Mihail Kondratyev Jan 22 '15 at 07:19
  • No. My idea is the following. Per your description, the distribution, related to the "no signal" situation, is simple Gaussian, hence there is no mixture. Alternatively, you can consider situation with signal presence as a mixture distribution: the original Gaussian and one or more other distributions. Therefore, I think that, by differentiating situations with mixture and without (that's _the criteria_), you can detect the presence of the signal. Does it make any sense? – Aleksandr Blekh Jan 22 '15 at 08:00
  • It makes sense. But i'm bad at R. Can you provide a minimal working example of such a detection in R with data from my question? – Mihail Kondratyev Jan 27 '15 at 07:02
  • I will try to create an [MRE](http://stackoverflow.com/q/5963269/2872891) in R for you, if it will not take a lot of time. – Aleksandr Blekh Jan 27 '15 at 07:32
  • I've tried my idea with _mixture analysis_ and it doesn't appear to work as I expected. I've also preliminary checked another approach that I think might work - _Fourier transformation_ and _power spectral density_ - but it is still TBD. Maybe more knowledgeable than me people will reflect on the feasibility of my ideas. – Aleksandr Blekh Jan 27 '15 at 09:56
  • Too bad. I've posted slightly changed question one more time. Hope I haven't broke any rules of this site. – Mihail Kondratyev Jan 28 '15 at 00:15
  • Don't post **the same** question multiple times!!! – Tim Feb 01 '15 at 19:42

1 Answers1

2

There is a problem with your sampling method. Your noise floor is too high or your signal is to weak. If you have the option, recalibrate your instruments/simulation and improve the signal to noise ratio (If you are using some kind of amplifier, turn down the gain.). The only statistical criterion that is able to distinguish the two images, as you hinted at yourself, is a measure of skewness (two for two tails). However, if you have constant predictable noise you could simply subtract the noise from the signal+noise to extract the signal, but this requires that the noise sample you subtract is representative of noise over time and is not fluctuating too much. Something similar could be achieved with an (online) filter. Your error term is much larger than your factor term, so it is like searching for a needle in a hay stack. I think even pattern analysis would be difficult to apply here.

Thanks to @AleksandrBlekh for pointing me to this question.

TLDR: Set up a criterion for skewness and use this as a classifier, unless you can reduce the noise floor during sampling.

noumenal
  • 632
  • 5
  • 14
  • Just discovered your answer accidentally (sometimes, SE notifications don't work well or at all). You're welcome. Interesting thoughts (+1). So, just to clarify: do you think that due to low signal/noise ratio, Fourier transformation and power spectral density approaches, suggested by me in a comment, are not suitable as well? – Aleksandr Blekh Mar 01 '15 at 23:40
  • 1
    @AleksandrBlekh I guess it is possible to use a 2-dimensional Fourier transform, but method aside I think that noise sampling and then using the noise as a reference will provide the clearest signal. This would simply be achieved by computing the difference image. You could do the same with transformed data, but unless you restrict the bandwidth for a specific expected-signal range, you cannot easily identify the signal (it is still possible, but why stare at so much noise...). This might require multiple filters if the signal appears at both 0 and -180°. – noumenal Mar 02 '15 at 08:57
  • I see. Thank you for a detailed clarification. Have you seen examples of such analysis in R? – Aleksandr Blekh Mar 02 '15 at 09:16
  • 1
    I think Matlab and Octave are better suited for DSP. I have no experience of such analysis in R. – noumenal Mar 02 '15 at 12:46
  • 1
    I agree - signal analysis is not terribly popular in R ecosystem. However, I've seen some DSP-focused R packages, while briefly researching for this question (was curious). I've also seen some tutorials, of which the following I like the best: http://www.di.fc.ul.pt/~jpn/r/fourier/fourier.html. – Aleksandr Blekh Mar 02 '15 at 12:52