I have some data that I'm playing around with; for simplicity, let's suppose the data contains information on number of posts a blogger has written vs. number of people who have subscribed to that person's blog (this is just a made-up example).
I want to get some rough model of the relationship between # posts vs. # subscribers, and when looking at a log-log plot, I see the following:
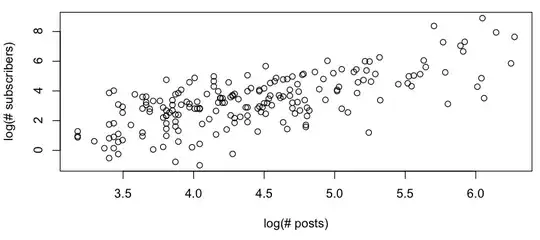
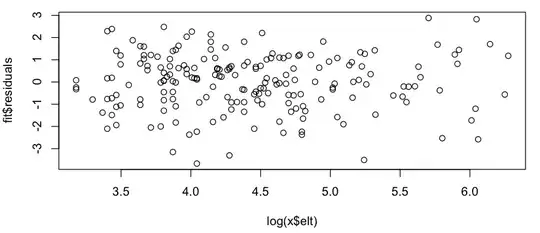
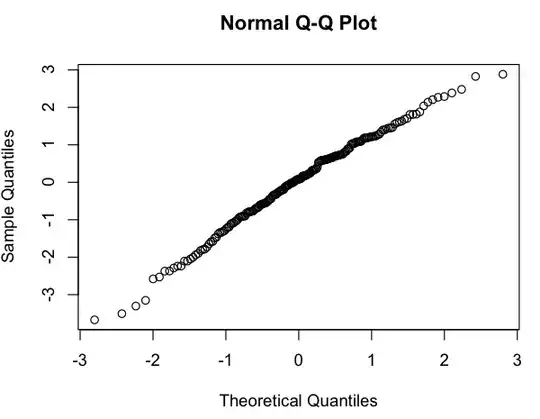
This looks like a rough linear relationship (on the log-log scale), and quickly checking the residuals seems to agree (no apparent pattern, no noticeable deviation from a normal distribution):
So my question is: is it okay to use this linear model? I know vaguely that there are problems using linear regressions on log-log plots to estimate power law distributions, but my data isn't a power law probability distribution (it's simply something that seems to roughly follow a $subscribers = A * (postings) ^ k$ model; in particular, nothing needs to sum to 1), so I'm not sure if the same critiques apply. (Perhaps I'm over-correcting at the mention of "log-log" and "linear regression" in the same sentence...) Also, all I'm really trying to do is to:
- See if there are any patterns to the blogs with positive residuals vs. blogs with negative residuals
- Suggest some rough model of how subscribers are related to number of postings.