On the linked page it introduces the equation as, "[t]he probability Q that a $\chi^2$ value calculated for an experiment with $d$ degrees of freedom... is due to chance". This suggests it is a version of the chi-squared distribution's CDF. Moreover, it looks a lot like the chi-squared distribution's pdf listed on the Wikipedia page, but with the integral added.
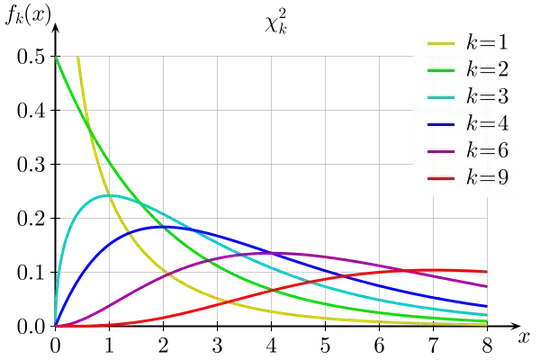
Recognize that any distribution's CDF (cumulative distribution function) is the integral of it's pdf (probability density function). If you were to draw what people think of as the 'shape' of a distribution, you are typically drawing the pdf. Here are some chi-squared pdfs from the Wikipedia page:
Integrating over this means that for one of the curves, you take the height of the line at every point from a lower bound (possibly as low as $0$) to an upper bound (possibly as high as $\infty$) and add them up. In the case of your equation, you have an integral that goes from the observed chi-squared value to infinity.
A defining feature of a pdf is that it must integrate (add up) to $1$. But the expression inside the integral does not necessarily add up to $1$. We can get out of this problem by dividing by the total, as any number divided by itself is $1$. Notice that the bracketed expression is raised to the power of $-1$; thus, you are dividing the integral by the bracketed expression. From this we can deduce that the bracketed expression is the total (or would be, if you integrated over the entire range from $0$ to $\infty$).
So this calculation is giving you the proportion of the chi-squared distribution that is to the right of / $\ge$ the observed chi-squared value. Namely, it is giving the $p$-value.
At this point I must state that the quote from the linked page that I pasted in above is incorrect. It actually gives a pernicious misunderstanding / myth about $p$-values. It states that the equation gives you the probability an experimental value is due to chance. This is false. Instead, this calculation gives you the probability a value drawn from this distribution would be that large or larger. You do not know whether your observed value was drawn from this (null) distribution or not, and the $p$-value is definitely not the probability that the null hypothesis is true. To get a clearer understanding of $p$-values, it may help to read this excellent CV thread: What is the meaning of p values and t values in statistical tests?