An example is here: http://www.reddit.com/r/askscience/comments/ine4x/regarding_the_recent_lapse_of_global_warming_in/c2554al
I'm sure it's related to robust statistics. But I'm sure that there's a label more specific than that.
==
Okay, so I tried to run regression analyses on global warming datasets over the last 10 years. What I wanted to show was that there was no significant warming trend over the last 10 years. However, because there are certain anomalous years, I wanted the argument to be more convincing, so I tried different start-year values. My point was to show that the premise behind the article (http://www.physorg.com/news/2011-07-global-linked-sulfur-china.html ) was basically correct. I'm not a climate change denier by any means as I work with climate scientists myself (I hate climate change deniers just as much as any other scientist) - however - the point is that China has released so much sulfur into the atmosphere that climate change had practically been stalled over the last 10 years (that being said, I have no doubt it will resume once again once China reduces the amount of sulfur-containing coal it uses)
I'll use the dataset from http://www.ncdc.noaa.gov/cmb-faq/anomalies.php - and particularly - the ftp://ftp.ncdc.noaa.gov/pub/data/anomalies/annual.land_ocean.90S.90N.df_1901-2000mean.dat dataset (the land+ocean anomalies), which is more scientifically rigorous
==
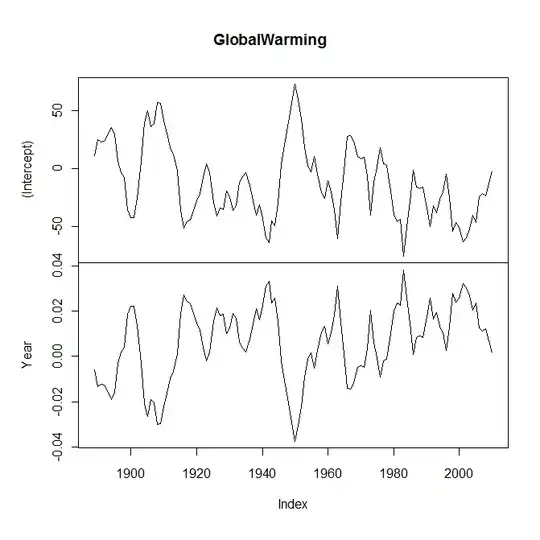
Anyways, by performing regression analyses on this data...
For the 1997-2010 period, for the coefficient of x, I get a value of 0.00722 degrees per year. This is not statistically significant, as the p-value is .13
1998-2010: 0.00515 degrees per year/p-value of 0.19. Not statistically significant.
For the 1999-2010 period, for the coefficient of x, I get a value of 0.01182 degrees per year. This barely meets statistical significance, as the p-value is 0.0457
2000-2010: 0.0089 degrees per year/p-value of 0.17. Not statistically significant
2001-2010: 0.0016 degrees per year/p-value of 0.759. Not statistically significant
2002-2010: -0.00167 degrees per year/p-value of 0.784. But here we have a negative slope
2003-2010: -0.00141 degrees per year/p-value of 0.86. Again, negative slope