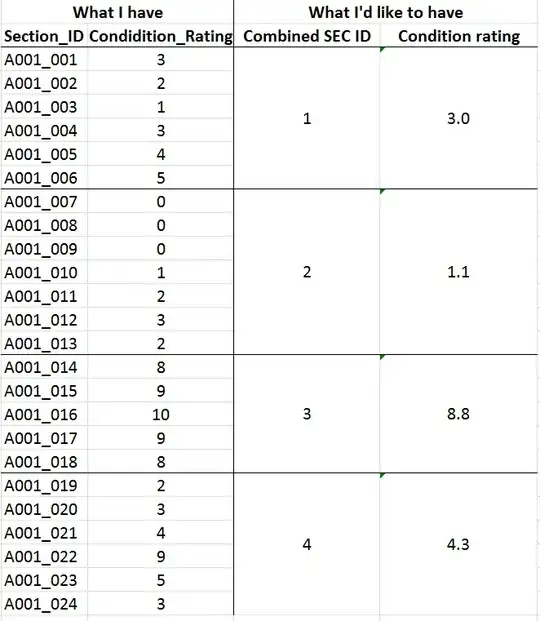
A dynamic program to minimize the sum of group variances subject to these constraints is simple and reasonably fast, especially for such a narrow range of group sizes. It reproduces the posted solution.
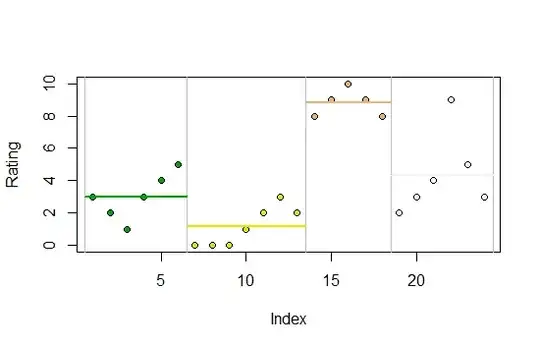
The data are plotted as point symbols. The groups are color-coded and separated by vertical lines. Group means are plotted as horizontal lines.
Commented R code follows. It computes the solution recursively, achieving efficiency by caching the results as it goes along. The program cluster(x,i) finds (and records) the best solution starting at index i in the data array x by searching among all feasible windows of lengths n.min through n.max beginning at index i. It returns the best value found so far (and, within the global variable cache$Breaks, leaves behind an indicator of the indexes that start each group). It can process arrays of thousands of elements in seconds, depending on how large the range n.max-n.min is. For larger problems it would have to be improved to include some branch-and-bound heuristics to limit the amount of searching.
#
# Univariate minimum-variance clustering with constraints.
# Requires a global data structure `cache`.
#
cluster <- function(x, i) {
  #
  # Cluster x[i:length(x)] recursively.
  # Begin with the terminal cases.
  #
  if (i > cache$Length) return(0)                    # Nothing to process   $
  cache$Breaks[i] <<- FALSE                          # Unmark this break    $
  if (i + cache$n.min - 1 > cache$Length) return(Inf)# Interval is too short
  if (!is.na(v <- cache$Cache[i])) return(v)         # Use the cached value $
  n.min <- cache$n.min + i-1                         # Start of search      $
  n.max <- min(cache$n.max + i-1, cache$Length)      # End of search
  if (n.max < n.min) return(0)                       # Prevents `R` errors
  #
  # The recursion: accumulate the best total within-group variances.
  # To implement other objective functions, replace `var` by any measure of
  # within-group homogeneity.
  #
  values <- sapply(n.min:n.max, function(k) var(x[i:k]) + cluster(x, k+1))
  #
  # Find and store the best result.
  #
  j <- which.min(values)
  cache$Breaks[n.min + j] <<- TRUE  # Mark this as a good break $
  cache$Cache[i] <<- values[j]      # Cache the result          $
  return(values[j])                 # Pass it to the caller
}
#
# The data.
#
x <- c(3,2,1,3,4,5,0,0,0,1,2,3,2,8,9,10,9,8,2,3,4,9,5,3)
#
# Initialize `cache` to specify the constraints; and run the clustering.
#
system.time({
  n <- length(x)
  cache <- list(n.min=4, n.max=10,      # The length constraints
                Cache=rep(NA, n),       # Values already found
                Breaks=rep(FALSE, n+1), # Group start indexes
                Length=n)               # Cache size
  cluster(x, 1)           # I.e., process x[1:n]
  cache$Breaks[1] <- TRUE # Indicate the start of the first group $
})
#
# Display the results.
#
breaks <- (1:(n+1))[cache$Breaks]                # Group start indexes $
groups <- cumsum(cache$Breaks[-(n+1)])           # Group identifiers
averages <- tapply(x, groups, mean)              # Group summaries
colors <- terrain.colors(max(groups))            # Group plotting colors

plot(x, pch=21, bg=colors[groups], ylab="Rating")
abline(v = breaks-1/2, col="Gray")
invisible(mapply(function(left, right, height, color) {
  lines(c(left, right)-1/2, c(height, height), col=color, lwd=2)
}, breaks[-length(breaks)], breaks[-1], averages, colors))