23

I want to generate two variables. One is binary outcome variable (say success / failure) and the other is age in years. I want age to be positively correlated with success. For example there should be more successes in the higher age segments than in lower. Ideally I should be in position to control degree of correlation. How do I do that?

Thanks

Jeromy Anglim
  • 42,044
  • 23
  • 146
  • 250
user333
  • 6,621
  • 17
  • 44
  • 54

3 Answers3

30

You can simulate the logistic regression model.

More precisely, you can first generate values for the age variable (for example using a uniform distribution) and then compute probabilities of success using

$$\pi ( x ) = \frac{\exp(\beta_0 + \beta_1 x)}{1 + \exp(\beta_0 + \beta_1 x)}$$

where $\beta_0$ and $\beta_1$ are constant regression coefficients to be specified. In particular, $\beta_1$ controls the magnitude of association between success and age.

Having values of $\pi$, you can now generate values for the binary outcome variable using the Bernoulli distribution.

Illustrative example in R:

n <- 10
beta0 <- -1.6
beta1 <- 0.03
x <- runif(n=n, min=18, max=60)
pi_x <- exp(beta0 + beta1 * x) / (1 + exp(beta0 + beta1 * x))
y <- rbinom(n=length(x), size=1, prob=pi_x)
data <- data.frame(x, pi_x, y)
names(data) <- c("age", "pi", "y")
print(data)

         age        pi y
 1  44.99389 0.4377784 1
 2  38.06071 0.3874180 0
 3  48.84682 0.4664019 1
 4  24.60762 0.2969694 0
 5  39.21008 0.3956323 1
 6  24.89943 0.2988003 0
 7  51.21295 0.4841025 1
 8  43.63633 0.4277811 0
 9  33.05582 0.3524413 0
 10 30.20088 0.3331497 1
whuber
  • 281,159
  • 54
  • 637
  • 1,101
ocram
  • 19,898
  • 5
  • 76
  • 77
  • 3
    Nice answer, though from an aesthetic standpoint (_not_ a practical one) a probit regression model might be even nicer. The probit model is equivalent to starting with a bivariate Gaussian R.V. and thresholding one of them (to zero or 1). Really it just involves substituting the Gaussian cumulative normal ("probit") function for the logit used in logistic regression. Practically this should give the same performance (and computationally it's slower since normcdf is expensive to evaluate (1+e^x)^-1), but it's nice to think about a Gaussian with one of the variables censored ("rounded"). – jpillow Jul 11 '11 at 06:44
  • @jpillow: Thank you for your comment. I will think on it asap! – ocram Jul 11 '11 at 07:04
  • 1
    What's nice about the probit / Gaussian copula model is that the parameters take the form of a covariance matrix between the two quantities (one of which is then binarized into 0 and 1). So it's nice from the standpoint of interpretability (but not so nice from the standpoint of computational convenience). – jpillow Jul 11 '11 at 08:25
21

@ocram's approach will certainly work. In terms of the dependence properties it's somewhat restrictive though.

Another method is to use a copula to derive a joint distribution. You can specify marginal distributions for success and age (if you have existing data this is especially simple) and a copula family. Varying the parameters of the copula will yield different degrees of dependence, and different copula families will give you various dependence relationships (e.g. strong upper tail dependence).

A recent overview of doing this in R via the copula package is available here. See also the discussion in that paper for additional packages.

You don't necessarily need an entire package though; here's a simple example using a Gaussian copula, marginal success probability 0.6, and gamma distributed ages. Vary r to control the dependence.

r = 0.8 # correlation coefficient
sigma = matrix(c(1,r,r,1), ncol=2)
s = chol(sigma)
n = 10000
z = s%*%matrix(rnorm(n*2), nrow=2)
u = pnorm(z)

age = qgamma(u[1,], 15, 0.5)
age_bracket = cut(age, breaks = seq(0,max(age), by=5))
success = u[2,]>0.4

round(prop.table(table(age_bracket, success)),2)

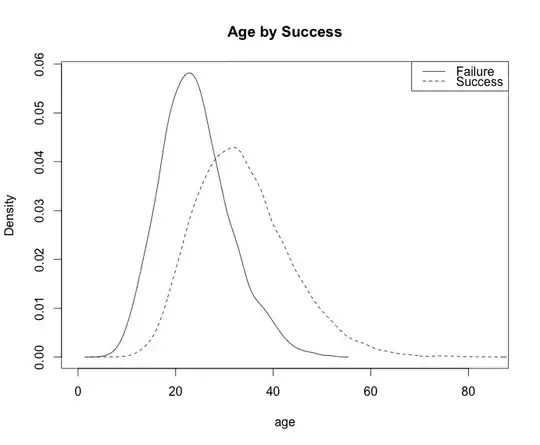
plot(density(age[!success]), main="Age by Success", xlab="age")
lines(density(age[success]), lty=2)
legend('topright', c("Failure", "Success"), lty=c(1,2))

Output:

Table:

           success
age_bracket FALSE TRUE
    (0,5]    0.00 0.00
    (5,10]   0.00 0.00
    (10,15]  0.03 0.00
    (15,20]  0.07 0.03
    (20,25]  0.10 0.09
    (25,30]  0.07 0.13
    (30,35]  0.04 0.14
    (35,40]  0.02 0.11
    (40,45]  0.01 0.07
    (45,50]  0.00 0.04
    (50,55]  0.00 0.02
    (55,60]  0.00 0.01
    (60,65]  0.00 0.00
    (65,70]  0.00 0.00
    (70,75]  0.00 0.00
    (75,80]  0.00 0.00

enter image description here

JMS
  • 4,660
  • 1
  • 22
  • 32
  • Great answer! Copulas are a beautiful if under-appreciated tool. The probit model (with Gaussian marginal on the continuous variable) is a special case of the Gaussian copula model. But this is a much more general solution. – jpillow Jul 11 '11 at 06:50
  • 1
    @JMS: +1 Yes, Copulas are very appealing. I should try to study them in more details! – ocram Jul 11 '11 at 07:04
  • @jpillow Indeed; Gaussian copula models subsume multivariate probit-type models of any sort. Via scale mixing they also extend to t/logistic copulae and logit/robit models too. Tres cool :) – JMS Jul 11 '11 at 15:34
  • @ocram Do! There are a lot of open questions in mixed data contexts (when using them as models and not just drawing from them) that people like me would love to see solved... – JMS Jul 11 '11 at 15:35
  • @JMS Excellent answer! – user333 Jul 12 '11 at 20:53
  • How can one extend this I to multivariate correlated variables... – user333 Jul 22 '11 at 22:33
  • make sigma bigger :) make sigma a correlation matrix of size $p$, then change z = s%*%matrix(rnorm(n*2), nrow=2) to z = s%*%matrix(rnorm(n*p), nrow=p). Then apply the inverse cdf/quantile function for each marginal distribution (that's what the "age=" and "success=" lines are doing). The key is that each row of u is marginally distributed unit uniform, but the columns are iid from a joint distribution with dependence determined by sigma. – JMS Jul 22 '11 at 23:12
  • Apologies that I'm posting this as a new answer - I'm new to this site and just can't see how to add a comment under an answer! Regarding JMS's answer using Copulas - how do you derive the correlation from the simualted data, in order to check that it's what you originally specified under rho? Or even to check if it is the ranked correlation, as I'm guessing the correlation of 0.8 doesn't continue to exist for the simualted data? Thanks. And apologies again for creating a new "answer". Can you email members directly on this site? –  Nov 09 '11 at 15:02
  • I think you need to accumulate some reputation before you can comment. This is reasonable to open up as a new question in and of itself (just reference this prior question and JMS's answer when making the new question). Welcome to the site. – Andy W Nov 09 '11 at 16:11
  • @JMS, is the method you described above essentially the [NORTA (Normal-to-anything)](http://citeseerx.ist.psu.edu/viewdoc/download?doi=10.1.1.48.281&rep=rep1&type=pdf) method for generating multivariate random variates? Great answer, btw. – null Dec 05 '13 at 18:07
1

You can first generate the success/failure variable ($X$), and then generate the age ($Y$) with a different distribution depending on the value of $X$. That will give you correlation.

To quantify the correlation, the simplest way is to shift $Y$ according to the value of $X$. The amount by which you shift will be a measure of the correlation.

Alex Monras
  • 401
  • 3
  • 8