I am trying to apply some data analysis on data which is generated by picking points from a sine wave with some noise added in. I am purposefully ignoring the time dependence, so just collecting data points and plotting in a histogram you get something like
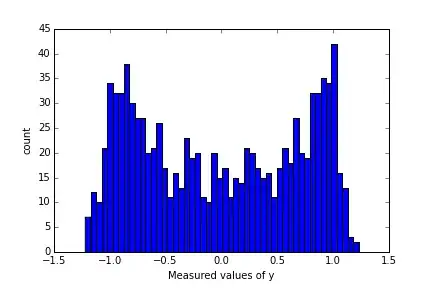
Image generated by (if that helps)
import matplotlib.pyplot as plt
import numpy as np
import pymc as pm

N = 10000
x = np.linspace(0, 2*np.pi, N)
y = np.sin(x) + np.random.normal(0, 0.1, N)
data = y[np.random.randint(0, N, 1000)]

out = plt.hist(data, bins=50)
plt.ylabel("count")
plt.xlabel("Measured values of y")
plt.show()
Now I need to generate a probability model. My current idea is that the measured y will follow a normal distribution with a distribution for its mean. The distribution for its mean should come from picking points from a sine wave without noise.
I know the pdf for picking points from a sine wave without noise, it is given by
P(y) = 1/sqrt(1 - ((y-y0)/A)^2)
where y0 and A are define in the following way: y = y0 + A*sin(t). For more about this, I already asked a question and was kindly helped on this site
So I naively tried to set this as the mean by doing something like (note I am using the data generated above to test my code works)
A = pm.Uniform("A", 0.1, 2)
y0 = pm.Uniform("y0", -10, 10)
std_dev = pm.Uniform('std_dev', lower=0, upper=50)

@pm.deterministic(plot=False)
def precision(std_dev=std_dev):
    return 1.0 / (std_dev * std_dev)

@pm.deterministic
def mean(value=0.1, A=A, y0=y0):
    return 1.0 / np.sqrt(1 - ((value-y0)/A)**2)

observed = pm.Normal("observed", mu=mean, tau=precision, value=data, observed=True)

model = pm.MCMC([observed, std_dev, y0, A])
However the samples don't seem to converge and even stranger I get values of y0 and A outside of the allowed regions.
As you may have guessed I'm fairly new to this. Some background in case it helps: I am attempting to do a model comparison between data generated by a sine wave (as above) and data generated by a square wave which was answered very nicely in this post. Both produce a bimodal distribution so are feasible for the data set.
All advice will be hugely appreciated.