This is a somewhat confusing debate because I am not sure how the two-regression method is going to achieve your goal.
Regression models with two continuous independent variables can be visualized as a 3-D space:
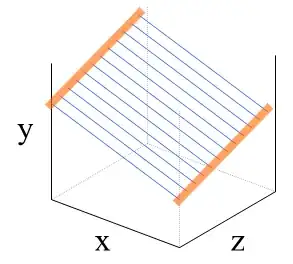
The blue lines represent the association between $x$ and $y$ at each value of $z$. Without $z$ in the model, the slope of the blue line may no longer be the same as the picture above because somehow $z$ could be associated with $x$ and in the same time a causal component of $y$. In such case, missing $z$ in the model will confound the association between $x$ and $y$. Aka, $\beta_1$, the regression coefficient of $x$ in $y = \beta_0 + \beta_1 x$ can be biased.
This 3-variable dynamics cannot be discerned just by examining $x$ on $y$ and $z$ on $y$ separately. I may consider them as an intermediate approach to understand the relationship between variables... but they cannot complete the job if seeing "amount of X given and amount of Z taken impacts Y" is your goal.
To complicate the answer slightly, your proposed method of performing a multiple linear regression with both $x$ and $z$ as independent variables may also be insufficient. Sometimes, the association of an independent variable may depend on the value of another independent variable, causing the regression plane to "warp." This is one of the many possibilities:
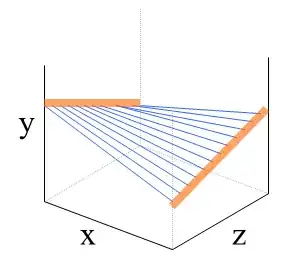
In this case, the association between $x$ and $y$ (the slopes of the blue line) changes at different value of $z$. If this is happening, you may need to modify your model by incorporating an interaction term between $x$ and $z$.
There is also collinearity that can affect the results of your multiple regression model as well.