18

What is meant by the statement that the kurtosis of a normal distribution is 3. Does it mean that on the horizontal line, the value of 3 corresponds to the peak probability, i.e. 3 is the mode of the system?

When I look at a normal curve, it seems the peak occurs at the center, a.k.a at 0. So why is the kurtosis not 0 and instead 3?

random_guy
  • 2,262
  • 1
  • 18
  • 30
Victor
  • 5,925
  • 13
  • 43
  • 67
  • 6
    As @Glen_b writes, the "kurtosis" coefficient has been defined as the fourth standardized moment: $${\beta_2=}\frac{\operatorname{E}[(X-{\mu})^4]}{(\operatorname{E}[(X-{\mu})^2])^2} {=} \frac{\mu_4}{\sigma^4}$$ It so happens that for the normal distribution, $\mu_4 = 3\sigma^4$ so $\beta_2= 3$. The _excess kurtosis_ usually denoted by $\gamma_2$ is $\gamma_2 = \beta_2(\text{Normal}) -3$. Care must be taken because sometimes authors write "kurtosis" and they mean "excess kurtosis". – Alecos Papadopoulos Dec 03 '14 at 00:38
  • 1
    Re: My previous comment. The correct expression for the excess kurtosis coefficient is $$\gamma_2 = \beta_2 - \beta_2(\text{Normal}) = \beta_2 - 3$$ – Alecos Papadopoulos Dec 03 '14 at 02:17

2 Answers2

30

Kurtosis is certainly not the location of where the peak is. As you say, that's already called the mode.

Kurtosis is the standardized fourth moment: If $Z=\frac{X-\mu}{\sigma}$, is a standardized version of the variable we're looking at, then the population kurtosis is the average fourth power of that standardized variable; $E(Z^4)$. The sample kurtosis is correspondingly related to the mean fourth power of a standardized set of sample values (in some cases it is scaled by a factor that goes to 1 in large samples).

As you note, this fourth standardized moment is 3 in the case of a normal random variable. As Alecos notes in comments, some people define kurtosis as $E(Z^4)-3$; that's sometimes called excess kurtosis (it's also the fourth cumulant). When seeing the word 'kurtosis' you need to keep in mind this possibility that different people use the same word to refer to two different (but closely related) quantities.

Kurtosis is usually either described as peakedness* (say, how sharply curved the peak is - which was presumably the intent of choosing the word "kurtosis") or heavy-tailedness (often what people are interested in using it to measure), but in actual fact the usual fourth standardized moment doesn't quite measure either of those things.

Indeed, the first volume of Kendall and Stuart give counterexamples that show that higher kurtosis is not necessarily associated with either higher peak (in a standardized variable) or fatter tails (in rather similar way that the third moment doesn't quite measure what many people think it does).

However in many situations there's some tendency to be associated with both, in that greater peakedness and heavy tailedness often tend to be seen when kurtosis is higher -- we should simply beware thinking it is necessarily the case.

Kurtosis and skewness are strongly related (the kurtosis must be at least 1 more than the square of the skewness; interpretation of kurtosis is somewhat easier when the distribution is nearly symmetric.

enter image description here

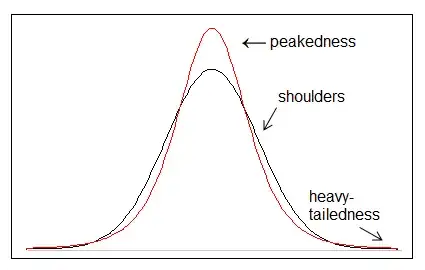
Darlington (1970) and Moors (1986) showed that the fourth moment measure of kurtosis is in effect variability about "the shoulders" - $\mu\pm\sigma$, and Balanda and MacGillivray (1988) suggest thinking of it in vague terms related to that sense (and consider some other ways to measure it). If the distribution is closely concentrated about $\mu\pm\sigma$, then kurtosis is (necessarily) small, while if the distribution is spread out away from $\mu\pm\sigma$ (which will tend to simultaneously pile it up in the center and move probability into the tails in order to move it away from the shoulders), fourth-moment kurtosis will be large.

De Carlo (1997) is a reasonable starting place (after more basic resources like Wikipedia) for reading about kurtosis.

Edit: I see some occasional questioning of whether higher peakedness (values near 0) can affect kurtosis at all. The answer is yes, definitely it can. That this is the case is a consequence of it being the fourth moment of a standardized variable -- to increase the fourth moment of a standardized variate you must increase $E(Z^4)$ while holding $E(Z^2)$ constant. This means that movement of probability further into the tail must be accompanied by some further in (inside $(-1,1)$); and vice versa -- if you put more weight at the center while holding the variance at 1, you also put some out in the tail.

[NB as discussed in comments this is incorrect as a general statement; a somewhat different statement is required here.]

This effect of variance being held constant is directly connected to the discussion of kurtosis as "variation about the shoulders" in Darlington and Moors' papers. That result is not some handwavy-notion, but a plain mathematical equivalence - one cannot hold it to be otherwise without misrepresenting kurtosis.

Now it's possible to increase the probability inside $(-1,1)$ without lifting the peak. Equally, it's possible to increase the probability outside $(-1,1)$ without necessarily making the distant tail heavier (by some typical tail-index, say). That is, it's quite possible to raise kurtosis while making the tail lighter (e.g. having a lighter tail beyond 2sds either side of the mean, say).

[My inclusion of Kendall and Stuart in the references is because their discussion of kurtosis also relevant to this point.]

So what can we say? Kurtosis is often associated with a higher peak and with a heavier tail, without having to occur wither either. Certainly it's easier to lift kurtosis by playing with the tail (since it's possible to get more than 1 sd away) then adjusting the center to keep variance constant, but that doesn't mean that the peak has no impact; it assuredly does, and one can manipulate kurtosis by focusing on it instead. Kurtosis is largely but not only associated with tail heaviness -- again, look to the variation about the shoulders result; if anything that's what kurtosis is looking at, in an unavoidable mathematical sense.

References

Balanda, K.P. and MacGillivray, H.L. (1988),
"Kurtosis: A critical review."
American Statistician 42, 111-119.

Darlington, Richard B. (1970),
"Is Kurtosis Really "Peakedness?"."
American Statistician 24, 19-22.

Moors, J.J.A. (1986),
"The meaning of kurtosis: Darlington reexamined."
American Statistician 40, 283-284.

DeCarlo, L.T. (1997),
"On the meaning and use of kurtosis."
Psychol. Methods, 2, 292-307.

Kendall, M. G., and A. Stuart,
The Advanced Theory of Statistics,
Vol. 1, 3rd Ed.
(more recent editions have Stuart and Ord)

Glen_b
  • 257,508
  • 32
  • 553
  • 939
  • Fun fact: Assuming that the excess kurtosis of the "standard" Normal distribution is $0$ the "standard" Laplace distribution has an ex. kurtosis $3$. (Obvious +1 for the great answer.) – usεr11852 Dec 14 '16 at 23:54
  • 2
    Westfall's article on kurtosis, titled Kurtosis as Peakedness, 1905-2014 R.I.P. is worth considering. It criticises DeCarlo (among others even listed above) for spreading knowledge of kurtosis as a peakedness measure Link here: https://www.ncbi.nlm.nih.gov/pmc/articles/PMC4321753/ – Lil'Lobster Dec 28 '16 at 12:52
  • 1
    @Lil I think Westfall overstates his case. By (almost) entirely focusing on heavy tails, he's strictly incorrect. While kurtosis is associated fairly strongly with heavy tails, kurtosis is demonstrably *not* heavy tailedness (counterexamples where heavier tails go with lower kurtosis are easy to find, as is covered in some of the references above; they're also easy to make). Kurtosis is associated less strongly with peakedness but there's still an association there; by insisting it's *not* peakedness he goes too far in his criticisms (similar criticisms apply to his own conclusions). ...ctd – Glen_b Mar 12 '17 at 00:14
  • ctd... By contrast the result discussed in the papers by Darlngton, by Moors, and by Balanda and MacGillivray - that's it's variation about the "shoulders" (suitably defined) - is unassailable, since it's an identity. – Glen_b Mar 12 '17 at 00:14
  • 1
    Glen_b, you and I both love math. If you are going to criticize me for "overstating my case", please give me your mathematical argument that connects Pearson's kurtosis with "peakedness". – Peter Westfall May 31 '17 at 23:54
  • @peter I've invited you on several occasions to briefly present your arguments in your answers (rather than just link to your paper as you have done several times) so they can be discussed here on CV. If you do so I can try to respond there, but I believe the essence of why I think as I do is already clear enough from my discussion here. Alternatively, if you post a question that would provide a way for people to respond. – Glen_b Jun 01 '17 at 02:20
  • Glen_b, I would love to hear your response to this. https://en.wikipedia.org/wiki/Talk:Kurtosis#Why_kurtosis_should_not_be_interpreted_as_.22peakedness.22 – BigBendRegion Oct 04 '17 at 22:36
  • @Peter Hi. Thanks. I can't look immediately, but I will take a look. I wrote a paragraph or so about the relationship between peakedness, heavy tails and kurtosis just recently here, so if it's relevant to what you have there I'll give a link to it, but I want to read what you say first. [.](https://stats.stackexchange.com/a/172532/805) . (Two weeks later: sorry, I have read but cannot reply yet; very busy for a few more days at least but I am getting to this -- I have written several relevant discussions I'd like to find and point to) – Glen_b Oct 04 '17 at 22:46
  • 1
    Gelen_b, your comment "This means that movement of probability further into the tail must be accompanied by some further inside mu +- sigma and vice versa -- if you put more weight at the center while holding the variance at 1, you also put some out in the tail" Is false. It must not. You can keep the probability (in fact the entire distribution) inside mu +- sigma constant and increase the kurtosis to infinity within certain parametric families of distributions. See here: https://math.stackexchange.com/questions/167656/fat-tail-large-kurtosis-discrete-distributions/2510884 – BigBendRegion Nov 11 '17 at 22:11
  • Agreed; that's false. It should change. – Glen_b Nov 11 '17 at 22:17
  • Thanks, Glen_b. The comment "if you put more weight at the center while holding the variance at 1, you also put some out in the tail" is also not mathematical; here is a counterexample: Let Z^2 = theta wp theta, = 2*theta wp (1-theta)/2, = 2 wp (1-theta)/2, where 0 < theta < 1. As theta -> 1, the probability inside mu +- sigma increases to 1, yet the tail length stays fixed at sqrt(2). Further, the kurtosis decreases to 1.0 as the probability within mu +- sigma increases to 1.0. – BigBendRegion Nov 14 '17 at 16:34
  • Glen_b, maybe more edits to your post above are in order? After all, there is no mathematical connection of kurtosis to the peak or to the probability content inside of the mu +- sigma range, as my counterexamples show. Or can you provide a theorem? I'd love to look at it. – BigBendRegion Nov 20 '17 at 00:18
  • HI Peter, I haven't yet edited it at all -- I agreed that it should change but I want to do it properly -- I simply don't have time to tackle it at the moment -- your own arguments have issues I want to address. My agreement here in comments that it's false will have to suffice for now; I will say more when I can but it will be at least a couple more weeks before I can devote a couple of hours to a fuller explanation. – Glen_b Nov 20 '17 at 00:56
  • @Peter I have inserted an explicit statement into the answer of what is wrong (which marks where I plan to edit). That will have to do for now. – Glen_b Nov 20 '17 at 01:00
  • Thanks, Glen_b. You might also consider whether your preferred definition of "tail heaviness" is relevant. Tail crossings are not interesting when too far out. For example, using your definition of "tail heaviness", the N(0,1) distribution has a heavier tail than the .9999*U(-1,1) + .0001*U(-1000, 1000) distribution, a silly conclusion. More edits of your posts are in order, not only here, but in a lot of your other posts. I seriously think you are doing a statistical disservice by presenting the kurtosis/tail issue as you have in various posts. It's not helpful or relevant. – BigBendRegion Nov 20 '17 at 02:11
  • It would be a mistake to characterize it as my "preferred" definition; I was trying to relate tail heaviness to the result that relates kurtosis to Var(Z^2). That doesn't make it a matter of general preference. No single definition will be adequate for every purpose. – Glen_b Nov 20 '17 at 03:32
  • Which result relates tail heaviness to kurtosis? I must have missed something. This point is crucial to this discussion. Of course, you have to define "tail heaviness" first, mathematically. – BigBendRegion Nov 21 '17 at 01:13
  • You have mentioned kurtosis being related to heavy tails more than once. What definition would you like? -- I am happy to talk about it in the context of several definitions even, as time permits. Or you can post youe own answer to any question you like and argue for or against any definitions you prefer to talk about or argue people should not talk about in them. – Glen_b Nov 21 '17 at 01:14
  • There is obviously no one definition of tail heaviness, Glen_b. It depends on what portion of the tail you would like to emphasize. And yes, for some measures of tail heaviness, those are not kurtosis. But many of those are not as relevant to statistical practice as the tail heaviness that is measured by kurtosis (for example, accuracy of variance estimates depends on tails through kurtosis and nothing else). As far as the theorems I have proven to relate kurtosis to tail heaviness, the definitions of tail heaviness that I use are (i) E(Z^4*I(|Z| >1)) and (ii) E(Z^4*I(|Z|>b)), for any real b. – BigBendRegion Dec 12 '17 at 01:30
  • Thanks Peter; I can discuss those in examples I use. (Yes, I realize there's no single definition, but if we use the same definition to start with we can at least be talking about the same thing) – Glen_b Dec 12 '17 at 08:14
  • Ok, let's use E(Z^4*I(|Z| >1)). – BigBendRegion Dec 13 '17 at 03:22
  • Having a look at it, I think the biggest issue there is whether that corresponds to an ordinary notion of tail heaviness. I think I can make the tail heavier in more typical senses while making that smaller, or vice-versa. But anyway, I'll still talk about it when I edit; it's an interesting way to tailor it to kurtosis like that. – Glen_b Dec 13 '17 at 10:23
  • Thanks, Glen_b. Further arguments in favor of that definition (since it is essentially kurtosis) are (i) that it governs accuracy of the estimated variance (ii) it appears in the correlation between s and xbar, and therefore underlies the accuracy of confidence limits, and (iii) it appears in the Cornish-Fisher asymptotic expansion of the distribution of xbar under non-normality. All of these effects relate to tails, not peak. – BigBendRegion Dec 15 '17 at 02:53
  • If that's "essentially kurtosis" then can I use $E(Z^4 \cdot I_{|Z|<1})$ and say it's "essentially kurtosis" too? (Otherwise your argument that it's essentially kurtosis sounds tautological; it would exclude all the cases that relate to peakedness in any way.) – Glen_b Dec 15 '17 at 05:19
  • @Glen_b, please get the inequality in the right direction. It is important. As I proved in my TAS paper, E(Z^4*I(|Z|>1)) is approximately equal to kurtosis. And of course, this measure has nothing to do with the peak of the distribution, where |Z| <1. – BigBendRegion Dec 19 '17 at 01:16
  • I chose the flip of direction deliberately to make a particular point; I'll address why when I write it up. – Glen_b Dec 19 '17 at 05:42
  • Please let me know when you do! – BigBendRegion Dec 30 '17 at 23:34
3

Here is a direct visualization to understand what the number "3" refers as regards the kurtosis of the normal distribution.

Let $X$ be normally distributed, and let $Z = (X-\mu)/\sigma$. Let $V = Z^4$. Consider the graph of the pdf of $V$, $p_V(v)$. This curve is to the right of zero, and extends to infinity, with 0.999 quantile 117.2, but much of the mass is near zero; e.g., 68% less than 1.0.

The mean of this distribution is kurtosis. A common way to understand the mean is as the "point of balance" of the pdf graph. If $X$ is normal, this curve $p_V(v)$ balances at 3.0.

This representation also explains why kurtosis measures heaviness of tails of a distribution. If $X$ is non-normal, the curve $p_V(v)$ "falls to the right" when the kurtosis is greater than 3.0, and so in this case the density of $X$ can be said to be "heavier-tailed than the normal distribution." Similarly, the curve $p_V(v)$ "falls to the left" when the kurtosis is less than 3.0, and so in this case the density of $X$ can be said to be "lighter-tailed than the normal distribution."

It is commonly thought that higher kurtosis refers to more mass near the center (i.e., more mass near 0 in the pdf $p_V(v)$). While in many cases this is true, it is obviously not the (possibly increased) mass near zero that causes the graph to "fall to the right" in the high kurtosis case. It is instead the tail leverage.

From this standpoint, the essentially correct "tail weight" interpretation of kurtosis might be more specifically characterized as "tail leverage" to avoid confusing "increased tail weight" with "increased mass in the tail." After all, it is possible that higher kurtosis corresponds to less mass in the tail, but where this diminished mass occupies a more distant position.

"Give me the place to stand, and I shall move the earth." -Archimedes

BigBendRegion
  • 4,593
  • 12
  • 22