3

This is crossposted from StackOverflow. Someone suggested I should post it here. Though I don't have enough karma to post images.

I'm working with gathering data from a biological monitoring system. They need to know the average value of the plateaus after changes to the system are made.

enter image description here

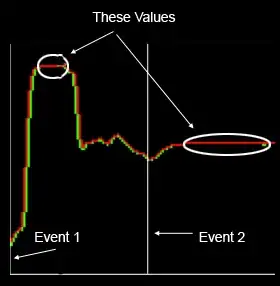
This is data for about 4 minutes. There is decent lag time between the event and the steady state response.

These values won't always be this level. They want me to find where the steady-state response starts and average the values during that time. My boss, who is a biologist, said there may be overshoot and random fluctuations... and that I might need to use a z-transform. Unfortunately he wasn't more specific than that.

I feel decently competent as a programmer, but wasn't sure what the most efficient way would be to go about finding these values.

Any algorithms, insights or approaches would be greatly appreciated. Thanks.

David Rinck
  • 131
  • 2
  • 1
    Please don't cross-post in future; and the proper way to move to other site is by asking for migrate using flag. –  Jul 02 '11 at 20:07
  • @svaha: Do you know *when* the level-changes occur? – cardinal Jul 03 '11 at 16:08
  • @svaha: Can you describe the monitoring system a little more? Is it assumed/known to be (approximately) a linear time-invariant system? If so, do you have any information on the zeros and poles of the system? If so, that would tell you quite a lot about the associate time constants of the system. – cardinal Jul 03 '11 at 16:16
  • Sure. Basically the events would be where air is moving in and out of a chamber. We know the first – David Rinck Jul 03 '11 at 19:51

1 Answers1

1

What you have is a time series interrupted by level shifts. These level shifts are often (in your case definitely!) not known a priori. I suggest that you investigate by googling "automatic intervention detection". This and other intelligent searches for intervention detection in time series should yield some results. The bottom line is to characterize/model your time series with both ARIMA and outlier detection. Outliers can be either pulses, level shifts, seasonal pulses and/or local time trends. Care should be taken to investigate the detection of interventions both using the observed data to build an ARIMA first and alternatively subsequent to the detection of the interventions. You might review some of my other postings on the subject of time series ; Outliers ; Exception Reporting particularly Outlier detection for generic time series .

IrishStat
  • 27,906
  • 5
  • 29
  • 55
  • 2
    I've taken the liberty of removing some of the capitalization of whole words and phrases, which is often interpreted as "shouting". Please check that I have not altered the intended content. I won't make further edits if you choose to rollback or edit my changes. Cheers. – cardinal Jul 03 '11 at 16:13
  • cardinal: I appreciate your corrections and your very friendly approach to needed improvements. You style is to be commended as it leads to "happy and prosperous villagers" hoping to help others. – IrishStat Jul 03 '11 at 16:38