2

I investigated experiments with SPSS and following values were out.

I have a question that in which case is possible to get Feature 1 in Group A+B as significant p<.05 while either Group A and B has low significance in Feature 1?

I hardly interpret because Group A have low correlation and Group B also, but combined group have correlation with (very) high significance.
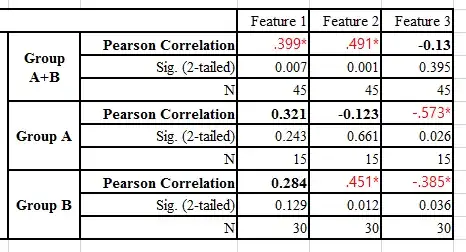
enter image description here

(* p<.05)

Youngjae
  • 123
  • 4

1 Answers1

7

Here you have a simple example with made-up data: there are two groups $A$ and $B$ and two variables $X$ and $Y$. In both groups alone the correlation of $X$ and $Y$ are small (r = -.17 and .23), but if you combine them you see a linear trend (r = .67).

enter image description here

So, as you can see, this kind of relation is possible. Local relations (or lack of them) is not the same as global relations. You can read more on atomistic fallacy and ecological fallacy - i.e. logical errors when drawing conclusions on groups based on individual level data or individuals based on group level data.

Tim
  • 108,699
  • 20
  • 212
  • 390
  • 1
    Simpson's paradox is related. One statement is that amalgamation of subsets can result in changed magnitude and even sign of relationships. – Nick Cox Nov 27 '14 at 11:26
  • Hi Tim, I think `X` and `Y` means random variable, it is clear, and what means `group` here? Like group `A` and group `B`? – Lin Ma Sep 23 '16 at 07:41
  • And you said "combine them", what exactly you do for `combine`? – Lin Ma Sep 23 '16 at 07:42
  • 1
    @LinMa X,Y are r.v. (on x- and y- axis of the plots). A,B are groups. By saying that I "combine" them I mean that I look at all of the data (third plot) ignoring the grouping. – Tim Sep 23 '16 at 07:53
  • Thanks Tim, what means groups here? I think in order to do Pearson's r square analysis, we just need two one dimension random variable? – Lin Ma Sep 24 '16 at 22:19
  • 1
    @LinMa groups are groups as in the question. – Tim Sep 25 '16 at 06:02
  • Thanks Tim, read the question and analysis again, and still feel confused about group here. I think X and Y are two random variable, and we draw its joint probability distribution in the plots here, it seems X and Y behaves different according to `group`? Is `group` some other random variable? And what means `+` in group A+B? – Lin Ma Sep 25 '16 at 07:01
  • Imagine you have two tests X and Y (say on mathematics and English), two groups of students A and B made the tests (say two classes). You can look at the test results taken together (A+B) or on results for each of the classes alone. – Tim Sep 25 '16 at 07:07