1

I have monthly values of a continuous variable from many subjects, the mean of which on plotting show curvilinear pattern with lower values in summer months. How can I analyze and report the significance of this data with p-values? Thanks for your help.

A plot of example data is given below:

enter image description here

About 5 subjects per day for 3 years are checked (each subject checked only once and is not repeated) and the data is arranged with following column headings:

subjectID, month, variable_reading
1, 1, 15
2, 1, 10
3, 2, 8
...

The question is "Does the variable have a significant seasonal variation?"

rnso
  • 8,893
  • 14
  • 50
  • 94
  • Post your data and perhaps we can help. If your data is .confidential simply scale it. – IrishStat Nov 26 '14 at 02:05
  • 1
    "Data" isn't significant or not. What questions do you seek to answer with the data? – Glen_b Nov 26 '14 at 02:17
  • I have added a plot of the data in my question above. – rnso Nov 26 '14 at 02:29
  • Is it a panel? You can run mixed effects on it if it is. – Aksakal Nov 26 '14 at 02:33
  • 1
    Although a cosmetic detail, try to persuade your software to show integers 1 to 12 as labels, not 2.5, 7.5, 12.5. In the absence of other information, this is a matter of seasonality. But the variability within months should also be unravelled and plotted against date, assuming that you have here the composite of several years' data. The nature of the data may guide appropriate modelling: if it's climatic or climatically driven, then a sinusoid may help; if it's social or economic, then incidence of holidays, vacations, etc. may be important. Half of time series analysis could be relevant.... – Nick Cox Nov 26 '14 at 02:45
  • Post the actual numbers not a graph. If you have seasonal data post a number of years . – IrishStat Nov 26 '14 at 02:46
  • @NickCox It is a health parameter of many individuals over 3 years. It seems to be seasonality. How can I give a p-value (significance) to it? – rnso Nov 26 '14 at 02:48
  • @IrishStat I want to know the methods which can be used to analyze such data. – rnso Nov 26 '14 at 02:49
  • 1
    As @Glen_b hinted, there is no significance assessment without a precise question to be answered. Several quite different models could be fitted here. By the way, a reduction to months could be throwing away useful detail if the data arrive more finely. – Nick Cox Nov 26 '14 at 02:51
  • For sure you want to understand the method BUT the approach may depend upon the data as @Nick pointed out. The actual data can be used to detail the steps. – IrishStat Nov 26 '14 at 02:51
  • 1
    A seasonal ARIMA model night be appropriate , a deterministic seasonal model with dummies might be appropriate , other models may also be of interest excluding models that use predictors such as time-squared, time-cubed etc. – IrishStat Nov 26 '14 at 02:58
  • The question is "Does the variable have a significant seasonal variation?" – rnso Nov 26 '14 at 03:09
  • If I do date-wise analysis I will have fewer subjects per day (say 5/day) but with monthly analysis I will have more per month (150/month). Which is better? – rnso Nov 26 '14 at 03:15
  • You don't have to choose either. You can quantify time of year as fraction elapsed since the beginning and with regression methods you don't even need data for every day. Months are just arbitrary units; the body doesn't know it's November. – Nick Cox Nov 26 '14 at 09:58
  • @NickCox : I am expecting a curvilinear relation. How can use regression for curvilinear data? – rnso Nov 26 '14 at 10:15
  • Very easily. Key words range from sinusoids (sines and cosines) through Fourier/periodic/trigonometric regression to TBATS. (Others no doubt.) – Nick Cox Nov 26 '14 at 11:38
  • @IrishStat : An answer regarding using seasonal ARIMA model here will be very much appreciated. – rnso Nov 26 '14 at 11:44
  • There are already many answers here on such methods, so I see no need for another. Here's one: http://stats.stackexchange.com/questions/60500/how-to-find-a-good-fit-for-semi-sinusoidal-model-in-r I'll emphasise that from the evidence shown, and what may be guessed, your data may not yield so easily as some physical data to this method. Also, the panel aspect of your data (several people) may need to be addressed. (A major point of the forum is missed if every question is expected to be answered as if it had never been asked before.) – Nick Cox Nov 26 '14 at 11:51
  • I appreciate your point. I am not clear about 'panel aspect of data'. From wiki: "Panel data contain observations of multiple phenomena obtained over multiple time periods for the same individuals". However, I am talking about only one parameter of different subjects taken at different times, not repeated testing. – rnso Nov 26 '14 at 11:56
  • I don't follow your distinction at all. Also, please use the word "parameter" in its statistical sense in a statistical forum: there is needless lack of clarity otherwise. You have several subjects followed over time. That's called panel or longitudinal data. Note that @Aksakal raised this point too. There is a lot of reading to do, and this forum contains many pertinent threads. – Nick Cox Nov 26 '14 at 13:00
  • @rnso this is a panel, except be careful with a term parameter which has a different meaning in statistics – Aksakal Nov 26 '14 at 13:06

2 Answers2

3

I simulated data a bit like yours, three years of daily data, 5 samples per day.

set.seed(42)
ts  <- seq(as.POSIXct('2012/1/1 00:00'), as.POSIXct('2014/12/31 23:59'), 'days')
ts  <- rep(ts, each=5) ## 5 samples every day
n   <- length(ts)

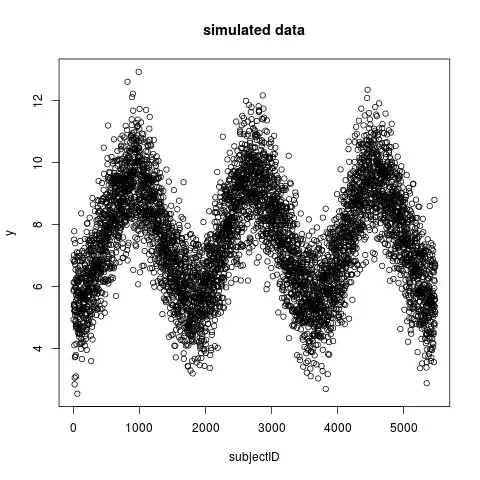
and generated a response by adding noise to a - b * cos(t):

y <- 7.5 + -2 * cos(seq(n)*2*pi/(365*5)) + rnorm(n,0,1)

The data have roughly the range and mean of yours, with a strong seasonal signal:

enter image description here

Form a data frame based on integer values and generate a month index:

d <- data.frame(sid=seq(n), month=as.POSIXlt(ts)$mon+1, y=round(y))
head(d)

  sid month y
1   1     1 7
2   2     1 5
3   3     1 6
4   4     1 6
5   5     1 6
6   6     1 5

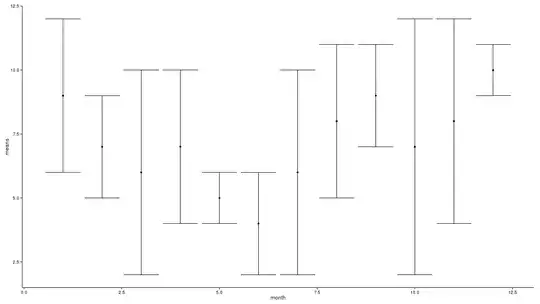
Plot the response by month:

boxplot(y~month, data=d, xlab='month', ylab='y', main='simulated data')

enter image description here

This is roughly similar to your own, with a seasonal signal both stronger and clearer.

Fit a very simple linear model with separate means for each month:

fit <- lm(y ~ factor(month), data=d)
summary(fit)

Coefficients:
                Estimate Std. Error t value Pr(>|t|)
(Intercept)      5.57419    0.04957 112.453  < 2e-16 ***
factor(month)2   0.47287    0.07173   6.592 4.74e-11 ***
factor(month)3   1.37849    0.07010  19.664  < 2e-16 ***
factor(month)4   2.41935    0.07010  34.512  < 2e-16 ***
factor(month)5   3.35054    0.07010  47.796  < 2e-16 ***
factor(month)6   3.86358    0.07068  54.661  < 2e-16 ***
factor(month)7   3.83871    0.07010  54.759  < 2e-16 ***
factor(month)8   3.23226    0.07010  46.108  < 2e-16 ***
factor(month)9   2.34358    0.07068  33.156  < 2e-16 ***
factor(month)10  1.35692    0.07068  19.197  < 2e-16 ***
factor(month)11  0.58803    0.07068   8.319  < 2e-16 ***
factor(month)12 -0.01075    0.07010  -0.153    0.878
---
Signif. codes:  0 ‘***’ 0.001 ‘**’ 0.01 ‘*’ 0.05 ‘.’ 0.1 ‘ ’ 1

Residual standard error: 1.069 on 5468 degrees of freedom
Multiple R-squared:  0.633, Adjusted R-squared:  0.6323
F-statistic: 857.4 on 11 and 5468 DF,  p-value: < 2.2e-16

The output here assumes January as a reference month and bundles the January mean with the intercept term. The significance of the individual month factors are then interpreted as "is the mean for this month significantly different to January?". For these data, all months are significantly different to January, except December. December and January are (statistically) indistinguishable from one another. One interpretation of this is that there is a seasonal difference between (southern hemisphere) summer months and the rest of the year.

This is not a great model by any stretch of the imagination. It doesn't even do a spectacular job at estimating the true simulated mean of 7.5. There are many shortcomings and criticsms that could be made. Importantly, it doesn't account for correlations in response between adjacent months, for example. It does, however, satisfy your initial criteria of answering the question about significant time-varying structure and reporting p-values. It's crude but "good enough" to detect a seasonal difference (in these data, even after a lot of detail has been lost to month binning). Any refinement to the correlation structure will only enhance it's sensitivity.

The point is not to defend this particular model but to say: any model you fit will have shortcomings. Finding an appropriate model for your needs depends on you having clear ideas about the goals of the analysis and the context in which it will be evaluated.

As @Nick Cox, @IrishStat (and others) have pointed out, there are many things that could be done here, almost all of them more sophisticated than this approach. But it is difficult to know what to suggest without a clear idea of what you aim to achieve. The question "Does the variable have a significant seasonal variation?" is not focused enough to guide the choice of model framework. In some contexts sARIMA may be warranted, in others the above may be adequate.

I hope that helps.

goangit
  • 566
  • 3
  • 12
  • Thanks for an excellent, well illustrated answer. It is of great help to me. – rnso Nov 26 '14 at 13:47
  • @goangit I made the distinction that often the seasonal component could be deterministic as you suggest. AUTOBOX actually tests for both kinds and furthermore will detect significant change points in the 11 seasonal dummies. From my post : "HOWEVER one should also consider models that have 11 deterministic dummies as a possible alternative." – IrishStat Nov 26 '14 at 15:52
  • What I mean is that no matter what software you are using you should consider both possible kinds of seasonality and definitely check on changes in parameters over time and of course changes in the error variance over time AND deliver remedies. – IrishStat Nov 26 '14 at 16:07
1

A seasonal ARIMA model is identified via the auto-correlation function. The kth order auto-correlation is essentially a regression coefficient . The k regression coefficients are each based upon a simple two variate model ( y versus x ) reflecting a lag effect of order k in x. A classic discussion (showing the unnecessary log transformation) of the very seasonal airline series may help http://www.autobox.com/pdfs/vegas_ibf_09a.pdf starting at slide 14.

If the 12th auto-correlation and the 24th auto-correlation etc. appear to haVe a decaying pattern this is often indicative of a seasonal auto-regressive process HOWEVER one should also consider models that have 11 deterministic dummies as a possible alternative. HTH.

IrishStat
  • 27,906
  • 5
  • 29
  • 55