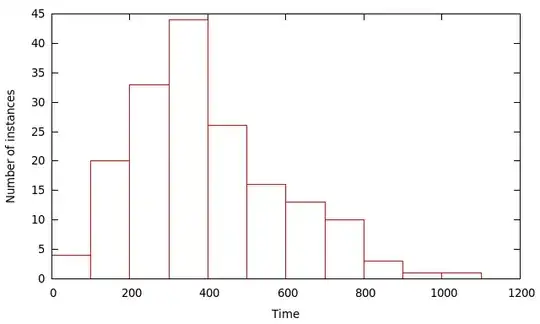
Knowing none of the relevant background, it looks like you may be able to reasonably fit a gamma distribution. (The exponential distribution is a special case of the gamma, in case that has any bearing on the mathematical grounds you mentioned.) I am no particle physicist: Even with the benefit of your edit, I cannot theorize why a gamma distribution would describe your phenomena of interest.
But there are plenty of distributions with support on $(0, \infty)$ and ways to assess fit. If you peruse a few of them, you'll find that many can be fit to give shapes similar to your histogram. Which is best suited could be a matter of assumption, theory, relevant literature, or a question to be answered from the data. Trying to eyeball it is little more than a guess.
To this question in your comment:
Suppose it's not clear which distribution it should follow - is it ever acceptable to just fit a distribution that looks right and draw conclusions from it?
I interpret "looks right" to mean a similarity between the histogram and the plot of an assumed density function. I cannot imagine a case in which this would be well-advised. As the answer Glen references in his comment nicely explains, our interpretation of histograms can be varied and sometimes inaccurate, depending on how they're assembled. An arguably better visual tool for visually exploring fit is a qq-plot. (See this example of them in action.)
All to say, visual tools are great for exploratory analysis, but the conclusions are best left to properly chosen tests. (Or posterior model odds, if Bayesian.)
