My sample size is less than 7. The discrete distribution has 5 values, skewed, bell-shaped. How to test that the sample is from this distribution?
Asked
Active
Viewed 192 times
4
-
1You will most likely have *very* little power. Can you say more about your data, the distribution in question, and the manner of deviation from the distribution that you care about detecting? – gung - Reinstate Monica Nov 20 '14 at 18:24
-
The distribution PMF is [0.03 0.12 0.6 0.2 0.05] for values [1:5]. I just want to see whether the sample is from this distribution. E.g. what is probability that a sample [3 3 3] is from this distribution. – Aksakal Nov 20 '14 at 18:29
-
2You can formulate the exact distribution based on all potential permutations and assigning them a probability based on your arbitrary PMF. See [my prior question](http://stats.stackexchange.com/a/74647/1036) for an example. In my paper with 7 bins (for days of the week) there is actually reasonable power for several plausible alternative hypotheses (i.e. limiting the probability to a few of the bins). – Andy W Nov 20 '14 at 19:44
-
2With such small sample size - with consequent low power against general alternatives - you will do better to focus on restricting the alternatives as far as possible. Are there particular alternatives you care most about detecting? (It's best to consider such issues before seeing the actual sample values.) – Glen_b Nov 20 '14 at 21:36
-
@Glen_b, the alternative would be that my sample is nor from the theoretical distribution. My application is for performance assessment. I'm rating a group of students, and want to show that the ratings are consistent with a suggested distribution. – Aksakal Nov 24 '14 at 16:24
-
@Aksakal - you need to be more specific about the alternative process to calculate its power. For instance, if you want to distinguish between `[0.03 0.12 0.6 0.2 0.05]` and `[0.03 0.12 0.61 0.19 0.05]` you will need a large sample, and it would be a silly test for only three observations (in which the power will be about equal to the Type I error rate - what I consider a silly test). For the potential alternative of each bin having equal probability, `[0.2 0.2 0.2 0.2 0.2]` the power with only 3 observations is not too bad at `0.5` as I show in my answer. – Andy W Nov 24 '14 at 16:38
-
@AndyW, my sample size is very small, less than 10. The theoretical distribution is given. – Aksakal Nov 24 '14 at 16:43
1 Answers
3
In my paper I linked to previously I provided a link to SPSS code to accomplish this, but I took some time to write up some functions in R to accomplish the same task for illustration. (The only external library needed is partitions.)
So here are a few functions to calculate the permutations (which are IMO the hardest part), then calculate the exact probability of each permutation, and then calculate the null distribution for the $\chi^2$ statistic.
#functions used in ExactProb
#Minimalist chi square, default equal probability for each bin
chiStat <- function(v,p=rep(1/length(v),length(v))){sum(((v - sum(v)*p)^2)/(sum(v)*p))}
#multinomial prob based on set of probabilities, defaults to equal probabilities
exactMult <- function(v,p=rep(1/length(v),length(v))){
    n <- factorial(sum(v))
    d <- prod(factorial(v))
    p <- prod(p^v)
    return( (n/d)*p )
}

#This generates all the permutations given n number of balls in m bins and
#then calculates the exact probability according to the multinomial
#distribution and the CDF of the chi-square statistic
exactProb <- function(n,m,p=rep(1/m,m)){
  library(partitions)
  AllDat <- t(compositions(n,m))
  ExactProb <- apply(AllDat,1,exactMult,p=p)
  chiStat <- function(v,p){sum(((v - sum(v)*p)^2)/(sum(v)*p))}
  Chi <- apply(AllDat,1,chiStat,p=p)
  #order according to chi-stat
  MyData <- data.frame(as.matrix(AllDat),ExactProb, Chi)[order(Chi),]
  MyData$cumprob <- cumsum(MyData$ExactProb)
  return(MyData)
}

#My wrapping all up in a global function to return items in list
#given the initial data
SmallSampChi <- function(d,p=rep(1/length(d),length(d))){
  n <- sum(d)
  m <- length(d)
  cdf <- exactProb(n=n,m=m,p=p)  #generate exact probability
  chiSamp <- chiStat(d,p)        #Chi stat for sample
  #p-value to the right of the test statistic
  pvalue <- sum(cdf[cdf[,'Chi'] >= chiSamp,'ExactProb'])
  #return object
  t <- list(cdf,p,d,chiSamp,pvalue)
  names(t) <- c("CDF","probabilities","data","Chi-Square Statistic","p-value")
  return(t)
}
So given your data in N balls in M bins format, we can use the SmallSampChi function to return the permutations and the p-value for your particular data set and the null probabilities listed.
#now with an example dataset, three events all on the third day
d <- c(0,0,3,0,0)              #format N observations in M bins, 3 in third bin
p <- c(0.03,0.12,0.6,0.2,0.05) #arbitrary PMF in comments
t <- SmallSampChi(d=d,p=p)
Here the exact probability of obtaining three values for the third bin is simply 0.6^3 = 0.216 - not a particularly rare occurrence, but for a general testing procedure this calculates the right tailed p-value for the $\chi^2$ statistic. (There is basically no power for small sample sizes to see if the left tail is too close to what you would expect.)
There actually are quite a few different combinations that would allow one to reject the null at an alpha level of .05, as can be seen by plotting the CDF of the exact null distribution.
plot(t$CDF$Chi,t$CDF$cumprob,type='s',xlab='Chi-Square value',ylab='Exact CDF')
abline(v=t$'Chi-Square Statistic',col='#FF000099')
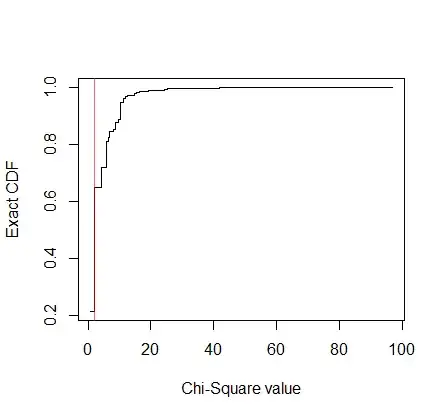
We can subsequently look at the potential permutations in which one could reject the null given your arbitrary PMF. (Ignore the numbers on the left, they are just the initial row names of the permutations before sorting.)
a <- .05
t$CDF[t$CDF[,'cumprob'] > (1-a),1:5]
#   X1 X2 X3 X4 X5
#6   1  1  1  0  0
#20  0  0  0  3  0
#12  1  1  0  1  0
#17  1  0  0  2  0
#23  0  2  0  0  1
#24  1  0  1  0  1
#27  1  0  0  1  1
#22  1  1  0  0  1
#3   1  2  0  0  0
#4   0  3  0  0  0
#33  0  0  1  0  2
#34  0  0  0  1  2
#32  0  1  0  0  2
#31  1  0  0  0  2
#5   2  0  1  0  0
#11  2  0  0  1  0
#2   2  1  0  0  0
#21  2  0  0  0  1
#35  0  0  0  0  3
#1   3  0  0  0  0
Mine and Glen_b's comments are not in contradiction - the power of this test will depend on how wrong your arbitrary PMF is. You will have more power especially if the bins in which you assign a small probability to, bins 1, 2 and 5, end up having a large probability or if bin 3 actually has a much smaller probability.
To calculate the power, simply calculate the exact probability for your alternative process, and then see add up the probability of drawing those samples under the null process that reject the null. Here is an example if the bins actually have equal probability for your example:
p_alt <- rep(1/5,5)
t$CDF$AltProb <- apply(as.matrix(t$CDF[,1:length(p_alt)]),1,exactMult,p=p_alt)
sum(t$CDF[t$CDF[,'cumprob'] > (1-a),'AltProb']) #power of alt
#[1] 0.536
I wouldn't consider 0.536 too shabby with only three observations. It will take more experimentation though to see whether combining bins is a better approach.
-
Does this work asymptotically? If my sample is (3,12,60,20,5) - what would be p-value in your approach? – Aksakal Nov 24 '14 at 16:01
-
This is the exact distribution, so it works for all sample sizes and does not rely on asymptotic properties. It would be possible to construct the exact distribution in the `(3,12,60,20,5)` case (it generates just shy of 4.6 million permutations) but is probably unnecessary. The exact CDF for the $\chi^2$ distribution is stochastic dominant over the asymptotic one, so using the asymptotic distribution only increases Type 2 errors, and those errors grow smaller with larger sample sizes. – Andy W Nov 24 '14 at 16:20
-
The $\chi^2$ value in your `(3,12,60,20,5)` case would be equal to $0$ (as the observed equals the expected in each bin), so the right tailed p-value would be $1$. (With that large of sample you can test the left tailed part of the distribution if you cared to.) – Andy W Nov 24 '14 at 16:21
-
Actually not quite exactly 1, as the probability of obtaining that particular outcome is `0.0005153454`, so it would be technically just under 1 for the exact distribution. – Andy W Nov 24 '14 at 16:37
-
+1 Combining bins is of course a particular subset of my suggestion of restricting the alternatives... which the OP refused point blank to consider. Sometimes you end up stuck with a less palatable restriction of the alternatives than the ones you could freely choose. – Glen_b Nov 24 '14 at 21:37