A lot of statistics textbooks provide an intuitive illustration of what the eigenvectors of a covariance matrix are:
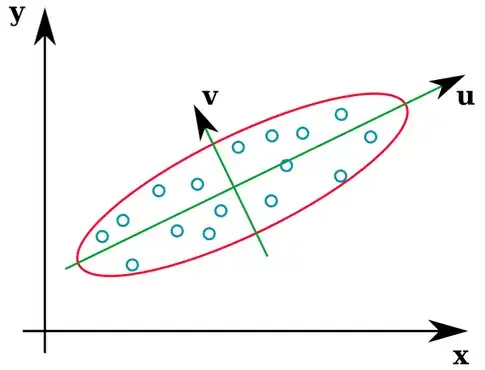
The vectors u and z form the eigenvectors (well, eigenaxes). This makes sense. But the one thing that confuses me is that we extract eigenvectors from the correlation matrix, not the raw data. Furthermore, raw datasets that are quite different can have identical correlation matrices. For example, the following both have correlation matrices of:
$$\left[\begin{array}{} 1 & 0.97 \\ 0.97 &1\end{array}\right]$$
As such they have eigenvectors pointing in the same direction:
$$\left[\begin{array}{} .71 & -.71 \\ .71 & .71\end{array}\right]$$
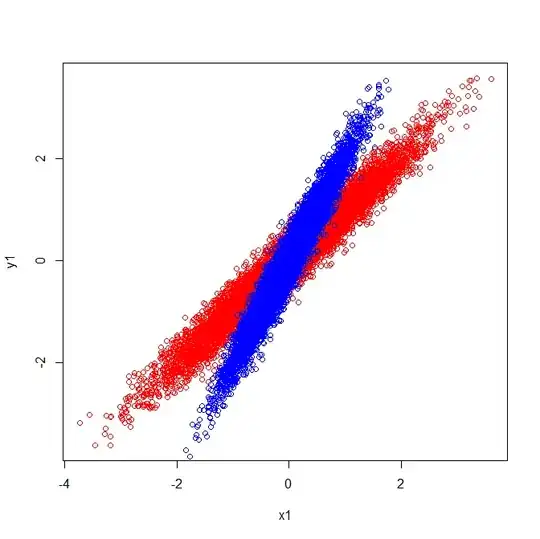
But if you were to apply the same visual interpretation of which directions the eigenvectors were in the raw data, you would get vectors pointing in different directions.
Can someone please tell me where I have gone wrong?
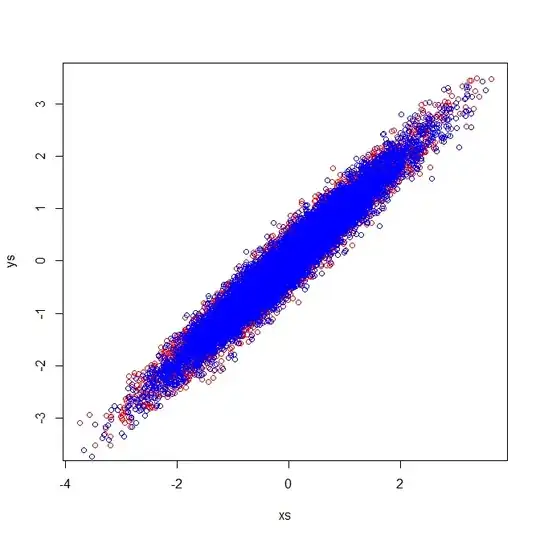
Second Edit: If I may be so bold, with the excellent answers below I was able to make sense of the confusion and have illustrated it.
The visual explanation coheres with the fact that the eigenvectors extracted from the covariance matrix are distinct.
Covariances and Eigenvectors (Red):
$$\left[\begin{array}{} 1 & 1 \\ 1 & 1\end{array}\right] \left[\begin{array}{} .7 & -.72 \\ .72 & .7\end{array}\right]$$
Covariances and Eigenvectors (Blue):
$$\left[\begin{array}{} .25 & .5 \\ .5 & 1\end{array}\right] \left[\begin{array}{} .43 & -.9 \\ .9 & .43\end{array}\right]$$
Correlation matrices reflect the covariance matrices of the standardized variables. Visual inspection of the standardized variables demonstrate why identical eigenvectors are extracted in my example: