0

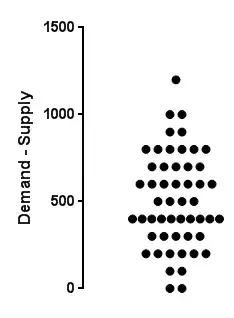
I have collected a set of data of 52 weeks of actual output and demand.

Actual 1100 1300 1400 1500 1600 1100 1200 1600 2100 1300 1600 1300 1600 2200 2300 1700 1800 800 1400 900 2100 1400 1800 1900 1000 1800 1700 2100 800 1100 900 1600 1700 1400 1100 1200 1700 900 700 900 1300 700 1500 700 1300 1100 1700 1600 1800 2000 1500 2100

Demand 1500 2100 1600 1500 2000 1600 1200 2000 2200 2000 2200 2000 2000 2500 2500 2000 2000 1000 2000 1500 2500 1500 2500 2500 2000 2000 2500 2500 1500 1500 1400 2000 2000 2000 1500 1500 2500 1500 1500 1500 2500 1500 2000 1500 1500 2000 2000 2500 2500 2500 2500 2500

Now I am having question in what test should I used and I I found out that one is normally distributed and the other one is not.

gung - Reinstate Monica
  • 132,789
  • 81
  • 357
  • 650
koksiang100
  • 31
  • 1
  • 4
  • Have you considered the Wilcoxon test? If you are comparing the means between output and demand and the normality assumption is violated you could always just use the [wilcoxon test](http://en.wikipedia.org/wiki/Wilcoxon_signed-rank_test). – cdeterman Nov 07 '14 at 16:50
  • Is that Wilcoxon test is only can be used if output and demand data are both violated the normality assumption ? Or it can just be used when either one violate the normality assumption? – koksiang100 Nov 07 '14 at 16:54
  • Are your weeks sequential? Ie, week1 A D, then week2 A D..., etc. You will almost certainly have serial correlation, which needs to be taken into account or your answer will be incorrect. – gung - Reinstate Monica Nov 07 '14 at 16:57
  • Yes, they are sequential... From 1st week - 52nd week.... Now I got to prove the actual output are having a significant difference compared to the demand. I have no idea where to start with.... any guidance? – koksiang100 Nov 07 '14 at 17:00
  • Given the sequential aspect, which I regrettably overlooked, you may want to look into repeated measures anova. The [Friedman test](http://en.wikipedia.org/wiki/Friedman_test) is typically considered the nonparametric equivalent. – cdeterman Nov 07 '14 at 17:07
  • Before I used the test, how do i prove the data is non-parametric set? – koksiang100 Nov 07 '14 at 17:14
  • What are you trying to find out from these data? – whuber Nov 07 '14 at 17:22
  • I want to find out the significance difference between these two sets of data. But before conducting the test,i have to do the normality test on data first. Am i on the right track ? – koksiang100 Nov 07 '14 at 17:28
  • @koksiang100, This is a different question from what you initially asked. Testing for normality has been asked [before](http://stats.stackexchange.com/questions/115610/normality-test-for-repeated-measures-data). There are many methods as well as just visually inspecting the distributions. – cdeterman Nov 07 '14 at 17:30
  • To be specific, I got p=0.415 for my ACTUAL OUTPUT data set( which is normally distributed) , however for demand data set, my p value is < 0.005 ( not normally distributed ). And now I don't know which test should I used ? Besides that, how to differentiate for the parametric / non-parametric ? – koksiang100 Nov 07 '14 at 17:41
  • @whuber Is this suitable to use Mann-whitney test to test the significance difference? Any assumption I need to make before I use this test? – koksiang100 Nov 08 '14 at 03:27

1 Answers1

2

My suggestion: For each week compute the difference between demand and supply (production), then analyze that list of 52 differences either with a one sample t test or a Wilcoxon rank sum test.

But there is no real reason to do any statistics, as Demand exceeds Supply every single week: enter image description here

Harvey Motulsky
  • 14,903
  • 11
  • 51
  • 98