As you describe them, your data constitute a mixture distribution. Assuming the distributions are known to be normal with known variances, the mean and variance of the mixture is:
\begin{align}
\mu_{\rm mixture} &= \sum_k p_k\mu_k \\
\sigma^2_{\rm mixture} &= \sum_k p_k\big((\mu_k - \mu_{\rm mixture})^2 + \sigma^2_k\big)
\end{align}
where $k$ indexes the component distributions and $p_k$ is the proportion of the mixture that each component constitutes.
Under your null hypothesis, the component mixtures all have the same means (for convenience, we can call it $0$). In addition, I gather the proportions are all $1/N$, since you have only one datum from each component. These facts simplify your situation quite a bit. Your data would have an expected variance equal to the sum of the known component variances. On the other hand, if the means vary then the variance of the component means can add considerably to the variance of your mixture.
Thus, you simply need to test if the variance of your data is greater than the sum of the known component variances. This can be done with a chi-squared test (see @Glen_b's anwer here: Why is the sampling distribution of a variance chi-squared?).
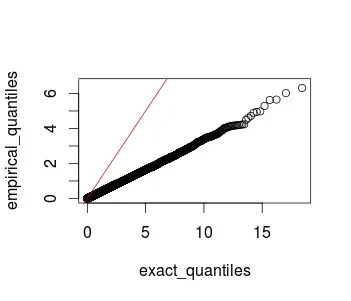
Here is a quick R demo: First I simulate the null hypothesis and show its distribution. Then I generate data where the null hypothesis is false and show the test. The data are three points drawn from normal distributions with means equal to $0$ (or they could have been anything else, so long as they are the same) and variances equal to $4$, $6$, and $8$. Thus the resulting mixture distribution variance is $18$. In this case there are three data points, so you have $2$ degrees of freedom.
set.seed(0884)                   # this makes the example reproducible
chi.vect = vector(length=10000)  # this will store the test statistics
for(i in 1:10000){               # I do this 10k times
  x  = c(rnorm(1,0,sd=sqrt(4)),  # here I generate the three data points
         rnorm(1,0,sd=sqrt(6)),
         rnorm(1,0,sd=sqrt(8)))
  vx = var(x)                    # this computes the variance of the sample
  chi.vect[i] = 2*vx / 18        # this computes the test statistic
}

x   = c(rnorm(1, mean=30, sd=sqrt(4)),  # these data come from distributions
        rnorm(1, mean=20, sd=sqrt(6)),  #   w/ different means
        rnorm(1, mean=10, sd=sqrt(8)))  # x   = 29.26698 26.00434 13.89382
vx  = var(x)                            # vx  = 65.60725
chi = 2*vx / 18                         # chi = 7.289695
1-pchisq(chi, df=2)                     # p   = 0.0261254

