6

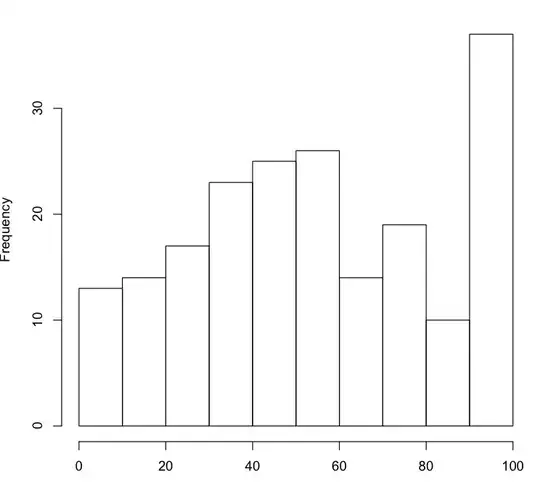
I have a data set with a dependent variable on a scale from 0 to 100 (n=198). The problem is that many subjects (25) scored exactly 100 but below 100 every score is achieved only once.

This distorts the histogram as you can see on the following link:

enter image description here

I'm trying to run an ANOVA (regression with two contrast coded predictors) and an interaction.

The interaction comes out non-significant, but I was wondering that maybe it is caused by the non-normality of the dependent variable.

Are there any robust methods to avoid this problem?

kjetil b halvorsen
  • 63,378
  • 26
  • 142
  • 467

3 Answers3

2

First a comment: "robust" usually refers to approaches guarding against outliers and violations of distributional assumptions. In your case, the problem is obviously a violation of distributional assumption, but it seems to depend on your DV (sorry for the pun).

What method to use depends on whether 100 is "truely" the highest possible value of your DV or if your DV measures an unobserved variable that has a latent distribution with possibly infinite values.

For illustration of the "latent variable" concept: On a cognitive test, you want to measure "intelligence", but you only observe if someone solves a question. So if some people solve all the questions, you do not know if these people all have the same intelligence or if there is still some variance in their intelligence scores.

If your DV is of the second kind, you could use tobit regression.

It's more difficult if your DV is really of the first kind, that is, if 100 is truely the highest score that could ever be measured.

And BTW, even with the "right" kind of approach you might still end up with a non-significant interaction.
wolf.rauch
  • 2,037
  • 1
  • 17
  • 11
  • Thanks for the quick reply! The dependent variable is basically an amount that participants could choose ranging between 0 and 100. So 100 is truly the highest score. Is there any method that maybe gives less weight to the 100s or might some rank-based methods help? –  Jun 22 '11 at 18:45
  • 1
    @daniel: I don't really know of a good way for that (I would have for the other problem :)) But my guess is that rank-based methods are probably the way to go. OTOH: not knowing the specifics, could it be that participants would have chosen even more if they were able to? – wolf.rauch Jun 22 '11 at 19:01
2

Rank based tests work by transforming the data to a uniform distribution then relying on the central limit theorem to justify approximate normality (the clt kicks in for the uniform around n=5 or 6), this helps counter the effects of skewness or outliers. Your data has the opposite problem and the rank transform is unlikely to help (the 100's will still all be ties in the ranks). For your sample size and the restrictions on the data, the normal theory tests are probably fine due to the clt. I would be more concerned about unequal variances if some combinations have only 100's or mostly 100's.

If you really want to you could do a permutation test, but I doubt that it will tell you much more than what you have already done, possibly using some statistic based on medians rather than the F-stat may help.

Greg Snow
  • 46,563
  • 2
  • 90
  • 159
  • Not clear on uniform distribution/CLT/normality and rank tests in this context. But I recommend the proportional odds model for this problem. It generalizes the Wilcoxon-Mann-Whitney-Kruskal-Wallis test. – Frank Harrell Jun 23 '11 at 04:14
1

Without knowing that the data are really about it's hard to say. One potential very general solution is to consider that 100 isn't really 100 (sometimes). What to do with that is what you need to work out. You need to come up with a model about what other values 100 is. Would some people have wanted to pick 1000? 110? 99.9? or was it just a garbage answer? If you can work that out then you can either throw data away or jitter it in log or linear space. You could add random noise to the 100s and do it repeatedly and see if outcomes are still relatively consistent across your conditions.

But without much more information it's hard to help. I hope that I've given you some things to think about.

John
  • 21,167
  • 9
  • 48
  • 84
  • the data is basically the amount of money participants were willing to invest ranging from 0 to 100, so yes it is possible that they might have wanted to pick higher values, but in the experiment they were only allowed to pick between 0 and 100, so its not really possible to find out what those values might mean. –  Jun 23 '11 at 02:13
  • If you've got 200 subjects and don't want to waste your data you might want to look at what happens with a variety of hypotheses about what would happen with a larger scale... or open ended. You can do that by distributing a proportion of your 100 scores. I tend to pick those that don't fit the distribution... not all of them. Explore, and see what happens. – John Jun 23 '11 at 02:44
  • what exactly do you mean by distributing a proportion of the 100 scores? I've checked separate histograms for each condition and both have similar histograms with the 100s hanging out in the end. I also tried removing all the 100s and seeing whether it becomes significant, but it doesn't. –  Jun 23 '11 at 14:14
  • For redistributing you've got to come up with a hypothesis about what the scores could be so I can't help you there. Also, when I say some, you've got to look at the current distribution. The rest of your data suggest that maybe 10 100s is still lots (assuming they should be something else). One way to look at it would be to run about 10,000 analysis in a loop keeping a random 10 of your 100s and tossing the rest. What's the average outcome then? – John Jun 23 '11 at 19:09