note: A few people have marked this question as duplicate - But my question here is not answered in the other question. Though a fine distinction, what I was asking about here was not whether the signs of a factor matters in the absolute, but whether there was any significance to the relationship between factors (i.e. whether they were largely the same sign, or largely different signs).
So I am fairly familiar with factor analysis, and am aware of answers here and here that tangentially address my question. I believe I am right in my answer to the question I'm asking, but I wanted to make sure.
Essentially, I have, for each of several hundred participants, answers to two sets of almost identical questions. For examples' sake, let's say these are ratings of their current mood state on 10 items at the start (A) and the end (B) of a questionnaire survey. I expect that these mood rating items should load onto two main factors (positive and negative) and that these loadings should be consistent (i.e. both sets A and B should break down similarly into two factors).
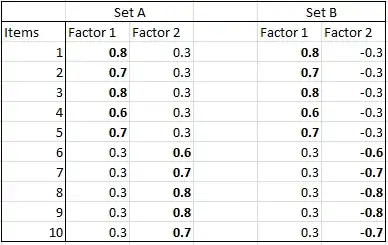
When I run the factor analysis, I find pretty much what I expected, except that for rating set A, items 1:5 load positively on factor 1, and items 6:10 load positively on factor 2, while for rating set B, items 1:5 load positively on factor 1, while items 6:10 load negatively on factor 2. Within each factor, the direction of the loadings are consistent across all items. This analysis was performed using varimax rotation.
Now, my understanding is that the difference between the two results is meaningless. Only the relative loading within each factor matters, and the reversal in sign is simply due to the factor analysis randomly converging on a factor that points in the opposite direction, but is essentially the same (except conceptually reversed). But I have had a colleague try to interpret the difference between the two analyses as meaning something with regards to the difference between the two factors.
Is my understanding right, or is there actually something to the difference?
A visual representation that might be more helpful - this is essentially what my output looks like: