3

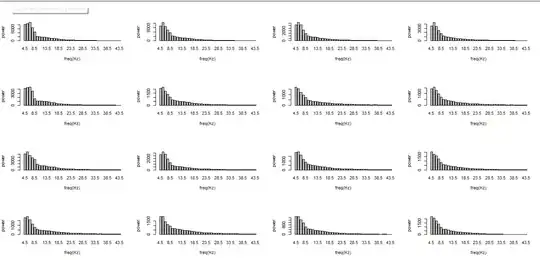
Could anyone point me to a good metric to distinguish between the following distributions? One distribution seems to be exponential type whereas the other is fatter and sometimes also has a peak around 16Hz.

Type 1 enter image description here

Type 2 enter image description here

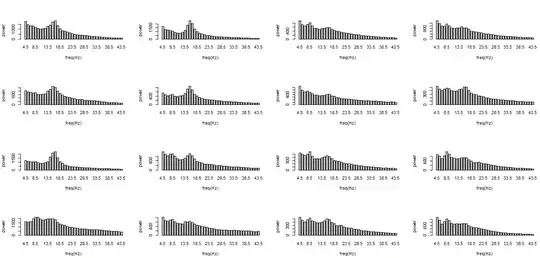
Given an unlabelled distribution, how to classify it as type 1 or type 2?

morpheus
  • 357
  • 1
  • 3
  • 8
  • 2
    The main distinction I see between the two collections is that the first lot all look unimodal and the second lot all seem to have at least two modes, and often more. You might want to consider whether that's what you really need to identify. – Glen_b Oct 19 '14 at 21:57

2 Answers2

1

It is unlikely that your histograms are going to be very helpful here. To diagnose whether a distribution has "fat tails" you would usually construct a tail plot (see this related answer). If you want to reduce that to a single metric then I would suggest conducting a weighted regression on the tails to estimate whether the tail behaviour is consistent with a power law, and if so, estimate the rate parameter in the power law. Anything less than cubic decay indicates a "heavy tailed" distribution in the sense of having an infinite variance.

Ben
  • 91,027
  • 3
  • 150
  • 376
0

My eye says that Type 1 distribution has higher kurtosis (it seems more peaked while Type 2 more flat) and smaller variance. Maybe from just these values combined with the mode/mean/median you could determine the distribution type, but the other central moments could also be informative. I would recommend you to grow a decision tree using these as features and possibly than try other combinations of central moments and mode/mean/median as explanatory variables and see what works.

Saul Berardo
  • 664
  • 4
  • 9