1

I have a data set measuring rock detection depths $Y$ based on the distance from some point of interests $X$, which are classified based on geophysical criteria. Each observation $Y$ is set after plowing the ground to determine if A) there is any chance of rock formation at all and B) what is the distance of the rock from the ground. In most cases the detection is unsuccessful and $Y$ is set to 0. Otherwise $Y$ it's set to a measure of rock depth.

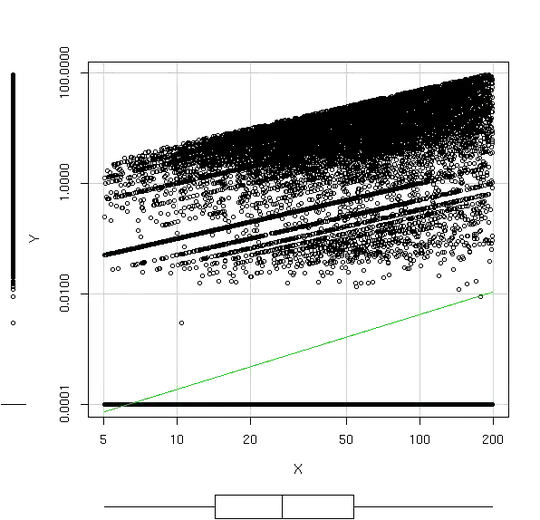
There is a linear relationship between $\log(Y)$ and $\log(X)$ as shown in the plot, for $Y \ne 0$. To allow for the $Y$ log transformation I added a small constant value, 0.00001 which is an order of 10 lower than $Y$ smallest value other than 0.

: X ~ Y

How should I model this data for prediction?

I thought about a convoluted solution using logistic regression to determine whether Y is higher than 0.0001 or not, then OLS to predict Y for each X when the result of the logistic estimator is higher than 50%. Is there a more sound approach?

amoeba
  • 93,463
  • 28
  • 275
  • 317
Robert Kubrick
  • 4,078
  • 8
  • 38
  • 55
  • 2
    Those data sure look a little screwy. Can you say more about what they are & where they come from? What do you want the model for? – gung - Reinstate Monica Oct 03 '14 at 22:03
  • Possibly censored regression would apply. I learned a lot from http://stats.stackexchange.com/questions/49443/how-to-model-this-odd-shaped-distribution-almost-a-reverse-j – rolando2 Oct 03 '14 at 22:25
  • @gung Added more information about the data source. – Robert Kubrick Oct 03 '14 at 23:07
  • My first thought would be a zero-inflated glm (say gamma with log-link and log(X) as a predictor) .... but looking at your log-log plot, the non-zero part of the distribution looks like a mixture of discrete and continuous, which makes me wonder if there's some important feature of the data that I've missed. – Glen_b Oct 04 '14 at 05:44
  • @Glen_b That is correct, data is a mixture of discrete (any rock detection) and continuos (depth). $X$ is the distance from the POI, which linearly predicts rock depth $only$ when rock is actually present. – Robert Kubrick Oct 04 '14 at 09:51
  • No, I'm not talking about the horizontal line at 0. I mean the positive sloping lines within the main mass (which is why I said "the non-zero part"). Are some depths more heavily rounded than others? – Glen_b Oct 04 '14 at 09:53
  • @Glen_b there are different regions and probes that probably shape the data differently but for now let's consider it a simple linear relationship. – Robert Kubrick Oct 04 '14 at 10:12
  • I'm talking about [the lines marked with orange arrows here](http://i.stack.imgur.com/dODON.png). Why is some data falling along lines (such as the indicated ones suggesting data that's discrete in a linear combination of log-x and log-y), while other data seems to have random scatter about the relationship? – Glen_b Oct 04 '14 at 10:43
  • @Glen_b It is possible that the different probes and areas used to collect data cause those jumps. I haven't looked at $X$ close enough, probably breaking it down in sub-groups could improve the fit. But the main issue here is the 0s. Why are you asking this, were you thinking about a full probit model? – Robert Kubrick Oct 05 '14 at 13:48
  • I was asking about it because at a superficial level it appears to invalidate most of the models mentioned here. In reality it may not be such an issue but I thought if I understood the source of that appearance it might give a better idea if there was a problem or not. I'd probably still use a zero-inflated gamma glm with a log-link, but I'd want to understand what was going on there. – Glen_b Oct 05 '14 at 14:48

2 Answers2

2

Unless there is a method that is tailored to what the 0.0001 values really mean, a good model to consider is one of the cumulative probability ordinal models such as the proportional odds ordinal logistic model. Such models can handle continuous $Y$ and also deal with arbitrarily large amounts of clumping at specific $Y$ values. The R rms package orm function is designed to handled continuous $Y$ fairly efficiently even when the model has thousands of intercepts. In ordinal models you need one intercept per unique value of $Y$ less one.

Frank Harrell
  • 74,029
  • 5
  • 148
  • 322
1

You can certainly specify a mixture model which will jointly model the probability that Y is 0.0001 alongside the linear relationship (given that Y is greater than this quantity) between X and Y. On the other hand, I'd first start with some questions about what the underlying process is.

I don't see a lot of variability (though it's hard to tell from the plot) in the proportion of 0.0001 counts over the range of X. Are they actually related, or is there some other sort of censoring process going on?

Also, I'd like to know more about those (seemingly perfect) linear patterns in the non-degenerate Y's. What kind of data is this?

  • Rephrased my question. – Robert Kubrick Oct 03 '14 at 23:06
  • I'm still not clear on what X is. You say that it represents a point, but what distinguishes high values of X from low values of X? – Grant Brown Oct 04 '14 at 04:19
  • $X$ is mainly a measure of distance from some POI of interesets. The idea is that the farther the probe from the POI, the higher the chance that the probe will detect a certain kind of rock formation. Indeed that's confirmed by the linear relationship in the plot, *except* for those cases where no rock was found at all. – Robert Kubrick Oct 05 '14 at 13:52
  • That still seems screwy to me. Think about the actual geological implication of the data as pictured - is the probe standing at the peak of a set of perfectly shaped, though somewhat porous, stacked cones of rock layers? Also, for problems like this, wouldn't a two dimensional location metric be more useful? – Grant Brown Oct 05 '14 at 16:12