2

I want to forecast tourist arrivals using time series analysis.

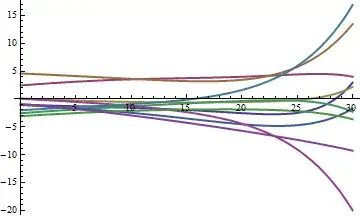
I expected to use monthly data from 2000-2013. But due to the civil war, the trend was changed after 2008 as in the following plot.

These are the data in Comma Separated Value format containing the monthly observations by rows, respectively for each year:

Year,1973,1974,1975,1976,1977,1978,1979,1980,1981,1982,1983,1984,1985,1986,1987,1988,1989,1990,1991,1992,1993,1994,1995,1996,1997,1998,1999,2000,2001,2002,2003,2004,2005,2006,2007,2008,2009,2010,2011,2012,2013
Jan,9386,10915,11740,15627,17569,23114,28366,36108,45168,40932,49104,33546,28814,32890,25446,20400,12962,26592,28932,35730,42726,45402,45987,30957,32652,37224,44379,43311,44187,28296,40647,49950,38187,52103,56553,56916,38468,50757,74197,85874,110543 
Feb,8343,9648,10388,15214,18064,22427,25226,33896,39384,40148,44018,32406,27012,30512,23714,19150,12344,26368,28080,38859,40116,41067,42591,29550,35010,35283,41526,43287,46575,31683,39081,43584,36645,52687,43051,40551,34169,57300,65797,83549,113968 
Mar,7875,9847,11158,13431,18216,20497,25472,34416,38376,42178,44710,32628,29886,28932,22838,19430,16032,26946,27153,33399,37953,41277,40074,26442,34098,32256,41022,40110,44290,33084,40818,38418,50418,54746,35031,38049,34065,52352,75130,91102,113208 
Apr,5468,6400,5890,8886,9891,11545,18847,21806,28568,29606,32556,23684,19778,19262,16238,13834,12312,22788,20541,28410,29589,28080,33756,20376,26907,25578,34443,33642,36906,27057,33714,30672,42261,49776,33039,29747,26054,38300,63835,69591,80737 
May,4168,3241,5587,6097,7602,8803,13042,19468,21642,28972,32850,18224,14014,13100,8204,11124,12750,18286,17745,21024,22368,21777,24672,17655,22407,20394,25212,23404,26924,26661,30048,30162,40878,43825,26307,31140,24739,35213,48943,57506,74838 
Jun,3246,3303,4787,4550,5536,7134,10674,15082,16836,25772,24350,17866,11092,9536,7650,11540,11630,18050,17394,23157,20412,21399,22416,19668,23160,22410,26184,21825,28323,26355,31836,32119,45699,44066,30810,27960,30234,44730,53636,65245,90279 
Jul,5919,5404,5925,4278,9881,13252,16801,22986,28266,30942,25132,26694,18362,12330,10200,17660,15194,26410,30645,33771,32904,35370,35994,25380,30867,29529,33288,33267,28566,35742,43743,50525,56745,55354,44142,32982,42223,63339,83786,90338,107016 
Aug,6680,6147,8565,3481,11129,15542,20203,27440,32788,34332,8430,27626,20138,15190,11408,18670,17220,26786,28824,40143,32796,32817,35814,24765,32034,31446,39081,34422,15717,35475,42111,48675,51216,52931,44742,30672,41207,55898,72463,79456,123269 
Sep,4184,4986,5287,6707,7594,10245,14798,19962,24086,29754,10050,21764,15242,12398,10072,14980,14264,22438,24762,29838,27495,31062,30828,23211,29793,31653,33915,31035,11758,32982,36054,51525,43536,38485,37104,29529,37983,47339,60219,71111,90339 
Oct,5977,6199,7622,10636,11541,14340,19376,23646,27030,30296,16410,25800,18176,12732,12146,16742,15050,23060,25173,32079,30621,33216,30603,23511,28314,31767,35112,26658,12904,36258,49922,59442,44095,38815,37011,35103,37575,52370,69563,80379,107058 
Nov,7137,8338,11271,13600,17106,20759,25743,23988,29512,33748,20570,27906,23218,18114,14188,10560,18948,24596,28272,35967,35103,33306,28365,24921,31995,38421,41952,32469,17344,37395,54946,64971,48457,37591,45102,36901,44311,72251,90889,109202,109420 
Dec,9505,10583,14984,16464,19536,24934,31616,37982,39086,40550,29350,29590,31724,25110,20516,8572,26026,35568,40182,41292,40167,42738,32001,35829,38928,45102,40326,36984,23300,42183,57722,66159,51171,39224,61116,48925,56862,84627,97517,122252,153918 

Should I use data ONLY from 2009-2013?

According to this book "A good model will allow for changing trend and changing seasonal patterns." So is there a really problem in using data from 2000-2013?

I'd be grateful if anyone can help me in this problem

Thank you

Gayathri
  • 55
  • 1
  • 1
  • 5
  • 2
    Sixty observations is not that bad but as you already know that the civil war changed the pattern of the series, why not include this event as an intervention and use the entire sample? This event may have affected the overall trend but there may be other patterns, for example, seasonality that remain similar to previous years. This [post](http://stats.stackexchange.com/questions/109420/intervention-analysis-pulse-over-several-periods) is related to what I mean. If you can post the data or give a link to the data if they are publicly available, you will probably get more specific feedback. – javlacalle Sep 29 '14 at 07:48
  • 2
    "But as it is not sufficient in time series analysis I supposed to simulate data." You can **never** get more information by simulating data that you do not have! Simulation can be useful, but it cannot create information. – kjetil b halvorsen Sep 29 '14 at 13:19
  • Thank you javlacalle for the intervention analysis you mentioned. I'm studying on that. Although I have 60 observations there are only 5 observations for each month. Therefore to study on a monthly basis isn't it insufficient? – Gayathri Sep 29 '14 at 13:36
  • but as it needs more data to use time series, are there any other steps I can take? – Gayathri Sep 29 '14 at 13:42
  • You may be thinking of bootstrapping techniques (if so, the tag "bootstrap" is more appropriate than "simulation" for your question). You can use them to get for example confidence intervals of the forecasts. However, bootstrapping time dependent data is tricky (I think you mentioned [this post](http://stats.stackexchange.com/questions/14213/calculating-confidence-intervals-via-bootstrap-on-dependent-observations?lq=1) in a previous edit of this question). At some point you will need to fit a model with the sample data that you have, which will in turn condition the bootstrap replicates. – javlacalle Sep 29 '14 at 17:41
  • In your case (looking at the plot you posted before), you can first try to fit a model for the entire sample including an intervention variable to capture the effect of the civil war. If the results are not satisfactory you may try working with the last sample of the series (2009-2013), it is not a long sample but it is what it is, you will have to accept higher uncertainty in the results. – javlacalle Sep 29 '14 at 17:41
  • Are the data available somewhere? – javlacalle Sep 29 '14 at 17:44
  • data are available in an excel file, but actually I don't know how to link it to this site – Gayathri Sep 29 '14 at 18:08
  • Actually bootstrapping is not working as it is not a method of data simulation. Hence I edited my post again. But I don't know whether simulation methods like Monte Carlo simulation will work on this better.I'm searching about that fact. – Gayathri Sep 29 '14 at 18:16
  • You can save the data as a CSV file and post the content of that file (to save space you may format the series as a matrix containing the years by rows and the months by columns). – javlacalle Sep 29 '14 at 19:40
  • I see you don't have enough reputation to chat (minimum of 20 is required). If you send me the excel file to the e-mail address that you can find in my profile I will post it for you. – javlacalle Sep 30 '14 at 08:04
  • I'm new to stack exchange.Just joined yesterday.I tried many links to post data file.But they were not working. I'll sent it. Thank you very much – Gayathri Sep 30 '14 at 08:17

1 Answers1

4

Addressing your question directly: I cannot think of a simulation method that could be used in this case to mitigate the problems of a small sample. (I mentioned bootstrap methods in the comments above but you already discarded this option.)

Additional comments motivated by the data provided in the question: The data seems to have undergone some changes that would probably require different models or at least parameter estimates at different subsamples.

Time series data with many observations are usually desired because that will allow us to get more accurate parameter estimates and hence better forecasts. However, the longer is the time series the more likely it will be subject to structural changes that will require additional care.

We can consider two options when working with long time series: 1) use the whole series and specify a model that can deal with structural breaks (if any); 2) use a subsample (the last years) which contains fewer data and less information but may be more homogeneous and, hence, assuming constant parameters throughout the subsample will be appropriate.

The decision depends on the purpose of the analysis. For a descriptive analysis, the whole series should be examined. In forecasting, observations taken 30 years ago may not be that relevant, especially if they were observed under a different scenario (e.g. political context).

I would say that you can stick to fit a model for the last five years of the sample, since it is the pattern that is more likely to continue in the next months. As the series is relatively volatile you will probably need to update or adjust the model as new data are recorded.

When the sample is small, information from other sources and expert knowledge becomes more relevant (see the quotes in this post).

As you probably know, the time series of tourist arrivals in Sri Lanka has been studied in this paper1: The authors define an econometric model with conditional heteroskedasticity volatility. The model includes as explanatory variables the exchange rate and tourism price. These variables contain information that can be helpful for forecasting.

[1] Sriyantha, F. etal. (2013). Political Violence and Volatility in International Tourist Arrivals: The Case of Sri Lanka. Tourism Analysis 01/2013; 18(5):575-586.

javlacalle
  • 11,184
  • 27
  • 53
  • Thank you very much. First I supposed to use bootstrapping,but one of my lecturers discarded that saying it is not a simulation method. Furthermore the sample at hand to use bootstrapping should be independent, but as time series observations are usually dependent he said that it is not suitable – Gayathri Oct 01 '14 at 04:15