Using this model why can't correlation be superior to 1 and goes down if points are not aligned ?
Asked
Active
Viewed 3,907 times
2
-
1Your question is not very clear - can you clarify your question? – Glen_b Sep 25 '14 at 07:36
-
sure I can there you go. – Wicelo Sep 25 '14 at 08:12
-
1I think you are confusing the terms 'covariance' and 'correlation'. Correlation is actually the standardized version of covariance and thus, by definition, will not be greater than +-1. – Fraukje Sep 25 '14 at 08:35
-
I was asking why dividing covariance by the product of standard errors was normalizing covariance but it was making the question not clear enough for some people. So I deleted it and now you tell me I'm confusing terms, please people get real ^^ – Wicelo Sep 25 '14 at 10:57
-
Contrary to the impression you have, people are trying to help. I agree with others that your question is still not clear: it's a one sentence question that obliges people to study another document. You have a good answer from @Glen_b: please accept it, or comment on why it doesn't help you. – Nick Cox Sep 25 '14 at 11:10
-
the document I gave is related to this answer http://stats.stackexchange.com/questions/18058/how-would-you-explain-covariance-to-someone-who-understands-only-the-mean/18200#18200 I'm trying to understand Glen_b answer but I would prefer an answer that fits with the `square area` view presented in the link. – Wicelo Sep 25 '14 at 11:19
-
I stopped reading that document at "An increase in the first trait can lead to: A large increase in the second trait, A small increase in the second trait, or A small decrease in the second trait." That statement is incorrect, because incomplete. – Nick Cox Sep 25 '14 at 11:28
1 Answers
3
That it can't exceed 1 follows directly from the Cauchy-Schwarz inequality - which if you know the inequality establishes things pretty intuitively. There are a number of common ways to motivate the result, but I'm going to give one you might not have encountered before ... and it also motivates the second part of your question.
The correlation can be rewritten in terms of standardized variables as follows:
$$r_{xy}=1-\frac{1}{2} \frac{\sum{(z_{x}-z_{y})}^2}{n}$$
where $z_x = \frac{x-\bar{x}}{s_x}$ and $z_y = \frac{y-\bar{y}}{s_y}$ are the z-scores corresponding to $x$ and $y$.
[This formula has a corresponding population form as well, so the same argument applies to $\rho$ as to $r$.]
a) Since the second term is necessarily non-negative, correlation can't exceed 1.
b) Further, the more different from equality the standardized scores for $x$ and $y$ become, the larger the second term becomes, so the correlation reduces.
[Readers familiar with the $1- {\frac {6 \sum d_i^2}{n(n^2 - 1)}}$ form of Spearman's rho may have spotted the similarity in formulas. This is no coincidence.]
In the plots below, we start with $z_x=z_y$ and then slowly increase the discrepancy between them, reducing the correlation:
$\quad$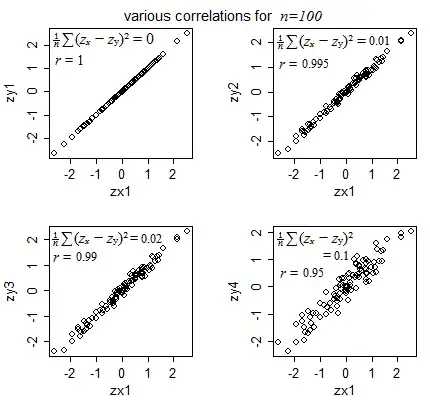
How does $\frac{1}{2} (z_x-z_y)^2$ measure deviation from lying on the $y=x$ line? Consider the area of a triangle formed by a point $(x,y)$ and the $y=x$ line:
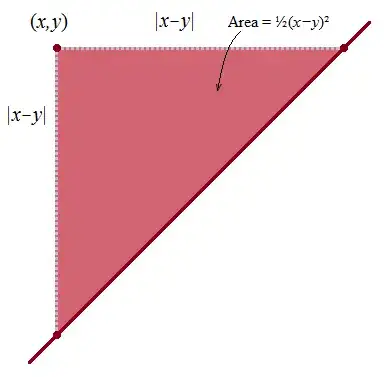
The further the point gets from the line, the larger the triangle, which has area $\frac{1}{2}(x-y)^2$.
So the term $\frac{1}{2} \frac{\sum{(z_{x}-z_{y})}^2}{n}$ is the average area of all the triangles formed by $(z_x,z_y)$ points and the $y=x$ line.
I believe there's a derivation of that deviation-from-linearity form of correlation in Rodgers, J.L., and Nicewander, W.A. (1988), "Thirteen Ways to Look at the Correlation Coefficient," The American Statistician, 42, 59-66. The many ways of looking at correlation there are a good source of various kinds of intuition about correlation.
As Nick Cox points out in comments, correlation is also the cosine of an angle (specifically, it's the cosine of the angle between the centered $n$-dimensional data vectors). As such, it has the same bounds as the cosine.
You may find this answer relating to covariance informative (since correlation is just the covariance of the standardized scores above). (Edit: oh, I see it's linked from the page you linked to, which seems to basically reproduce whuber's argument, but not present it nearly as nicely.)
-
1As you know, another argument is that a correlation is, or equivalent to, a cosine, and so has the same bounds. – Nick Cox Sep 25 '14 at 09:31
-
@ Glen_b How do you get the `r` formula you wrote ? How do you know the minus term won't get superior to 2 ? How do you interpret the formula visually ? – Wicelo Sep 25 '14 at 14:00
-
The formula is available in many sources (e.g. Cohen and COhen 1975), but not difficult to derive. It would be out of place to offer an algebraic derivation in a question looking for an intuitive explanation. You can identify the limit of it at the other end by a simple symmetry argument, but your question only asked about the *upper* bound, not the lower, which was why I offered that formula in the first place, If you'd asked about both bounds I'd have offered a different source of intuition. Don't expect an intuitive answer to one question to be equally intuitive to a question you didn't ask – Glen_b Sep 25 '14 at 23:18
-
The plot I included was an attempt to help you interpret the formula visually, but I've added an extra plot and some discussion to show in greater detail how that measures deviation from linearity. There are several articles on Wikipedia that relate to correlation that convey several other forms of intuition about correlation. – Glen_b Sep 26 '14 at 00:38
-
Actually, if I recall correctly, there's a derivation of that deviation-from-linearity form of correlation in Rodgers, J.L., and Nicewander, W.A. (1988), "Thirteen Ways to Look at the Correlation Coefficient," *The American Statistician*, 42, 59-66. The many ways of looking at correlation there form a very good source of various kinds of intuition. – Glen_b Sep 26 '14 at 00:48