I would appreciate if someone could explain what these two statements mean, like to a non-statistian (a dummy).
Let me try to do it by avoiding complex terminology.
First, you should understand what a simplex is. This answer explains it graphically: https://stats.stackexchange.com/a/296779/172825
To recap, every point in that simplex-triangle has a very nice property - it's in fact a particular multinomial distribution. Why? If you look at any point, its "vector" sums up to one and all "items" are between 0 and 1.
I tried to naively visualize Dirichlet distribution in the following figure.
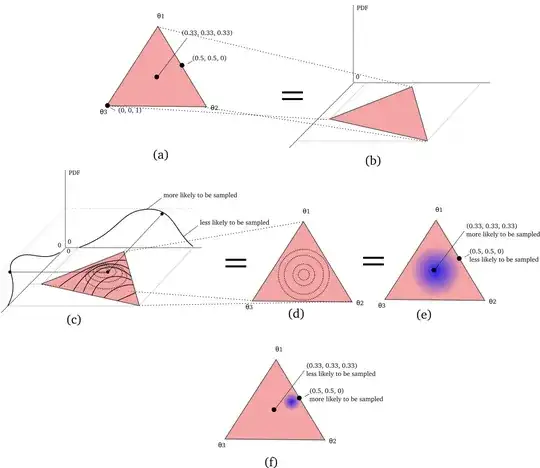
(a) shows a 3-simplex (as explained in the linked question). There are 3 example points shown with their "coordinates" so you can see that each of them is a multinomial distribution.
(b) let's put the triangle on the floor and the vertical axis be a probability density function
(c) is one particular example of Dirichlet distribution (I guess the parameters might be $\alpha = (2, 2, 2)$, roughly) - a kind of "mountain" in the middle of the triangle (sorry, I can't really sketch 3-D mountains easily). But you get the gist - the higher on that mountain, the higher the PDF value, thus the higher the chances a random sample will end-up here.
(d) just shows the "mountain" from the top as a contour-line plot; in reality the circles are not actual circles but that's a detail (e) is the same thing but using some kind of heat map (so the darker the blue is, the higher probability); such heat maps are shown in some literature on Dirichlet distribution
(f) is another Dirichlet distribution (different $\alpha$ parameters)
So what does it mean to "draw a multinomial distribution from a Dirichlet distribution"? You simply pick any point from that triangle (because every point is a multinomial distribution, remember?). Darker areas (or "higher" areas if you like the mountain analogy) just get higher chances to get sampled.
I'm not a statistician so I hope it's a correct explanation.