2

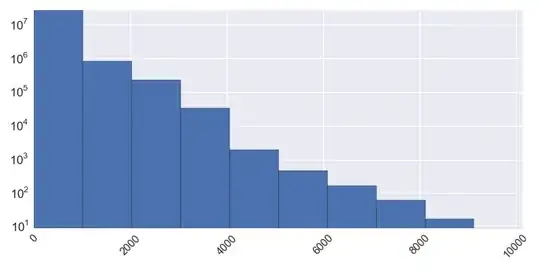
I have an empirical distribution that looks like the the image below and I hoping to model it with some parametric distribution. The X axis measures "number of buckets", while the Y axis measures **number of unique users in a given number of buckets*.

I am starting to explore the problem, but our prior knowledge about the problem would suggest that users choose to be in a bucket independently of each other and independently of other buckets they belong to.

For example the left-most bar in blue effectively shows that buckets of sizes between 0-1000 are the most common ones in the data.

From the list of "known" parametric distributions, what type of distribution could capture this problem or exhibit the pattern shown below?

distribution

kjetil b halvorsen
  • 63,378
  • 26
  • 142
  • 467
Amelio Vazquez-Reina
  • 17,546
  • 26
  • 74
  • 110
  • 1
    Looks exponential to me. – Sycorax Sep 18 '14 at 22:11
  • 2
    Beware trying to [judge distributional shape from a histogram with very few bins](http://stats.stackexchange.com/questions/51718/assessing-approximate-distribution-of-data-based-on-a-histogram/51753#51753). Can you do one with about 4-10 times as many bins, and maybe an exponential QQ-plot? What does a histogram or KDE of the logs look like? – Glen_b Sep 18 '14 at 23:30

1 Answers1

1

Partially answered in comments:

Looks exponential to me. – Sycorax

Beware trying to judge distributional shape from a histogram with very few bins. Can you do one with about 4-10 times as many bins, and maybe an exponential QQ-plot? What does a histogram or KDE of the logs look like? – Glen_b

Another illustration is here.

kjetil b halvorsen
  • 63,378
  • 26
  • 142
  • 467