The correct answer should be similar, so that's probably correct; by my reckoning the box plot's lower inner-fence is -12.45 so your quartiles are probably fine (sample quartile definitions vary, but are generally close to Tukey's hinges, and - for some quartile definitions at least - sometimes hinges and quartiles do coincide).
Since all your observations are positive, there are no "outliers" (by the present definition) on the low side.
If your data are necessarily positive but sufficiently right-skew and with some values close to zero, negative values for the inner fence are quite common.
The rule has no way to know that negative values are impossible for your data; the rule isn't necessarily entirely appropriate for this kind of data, but it looks to me like you have correctly carried the calculation out on the data you have.
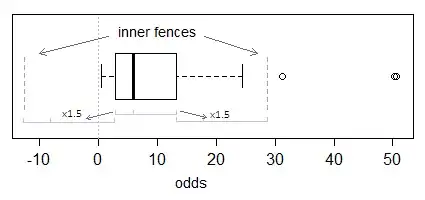
Incidentally, for the boxplot, here's an illustration of essentially the same "outlier" bound calculation: