4

I'm faced with a practical problem of solving for a 1-D function which has noise, so find myself in the territory of stochastic approximation (and I am well out of my comfort zone here!). I know there is some literature on the problem, but I've yet to find anything on the particular case I have in mind, where the noise is positive, to be precise: I can obtain values $f_i(x) = f(x)+\eta_i$ where the $\eta_i$ are noise, but also positive, and seek $x$ such that $f(x)=0$.

Thanks in advance!

[Edit, in response to comments]

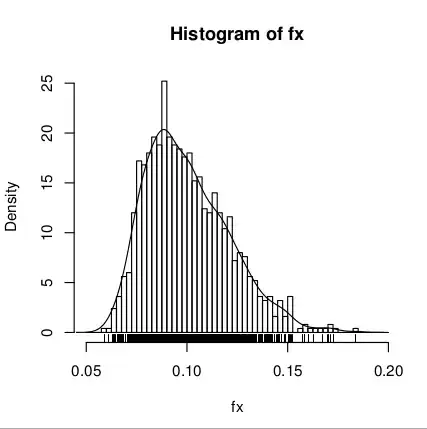
I don't know for sure that the function $f$ is continuous, but it seems to be. Nor do I have any definitive information on the noise excepting its positivity (and I know that it is positive since the $f_i(x)$ are simulated annealing minimisations of a precisely defined objective); I do, however, have some empirical data -- here 1000 evaluations of $f_i(x)$ for a fixed $x$, the minimal value is 0.0588:

enter image description here

[Edit 2]

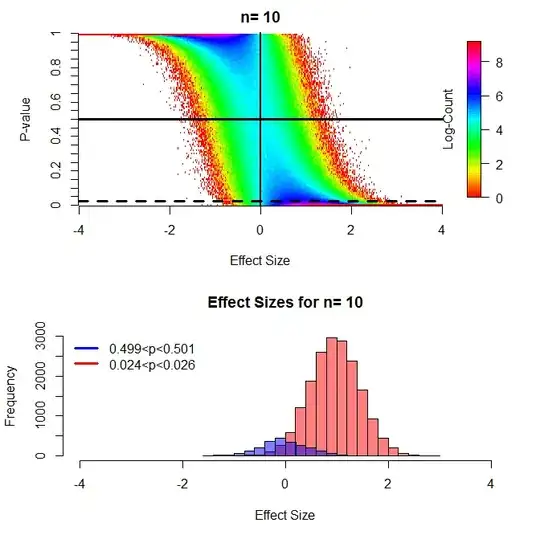
A "noisy plot" of the function $f(x)$ as requested in comments, there are multiple samples at some of the locations where the function is sampled, but not all. I am actually interested in $f(x) = 0.5$, so in terms of the original question, subtract 0.5 from $f$

noisy plot of the function f

J.J. Green
  • 141
  • 3
  • I've added the `stochastic-approximation` tag; I think we have a couple of posts that would merit the tag already. Likely `root-finding` should get one but I want to ponder that. I am even a bit less sure about `positive-noise` – Glen_b Sep 01 '14 at 01:23
  • 1
    Can you say anything about the positive noise, other than it's positive? What can you say about $f$, if anything? Is it smooth? – Glen_b Sep 01 '14 at 01:24
  • In general, it is better to explain the concrete problem you are trying to solve, and leave the experts such as glen-b to determine a suitable abstraction. – seanv507 Sep 01 '14 at 17:39
  • Can you tell us the distribution of the noise? Do you at least know its mean? Can you show us a "noisy" graph of the function plus noise? Have you tried interpolating through the noisy function, then finding the roots of the interpolant? – Kirill Sep 02 '14 at 03:21
  • The histogram of $f$ would not seem to be of much relevance for the purpose of finding *roots*, because it has stripped away all information about the relationship between $f$ and its parameter. It is helpful, though, in making clear this problem is insoluble. Your data could be consistent with *no* roots--after all, there's not a single sign change since all the values are positive--or even infinitely many roots (which could occur if the mean of the noise were around $0.10$) and there's no way to tell where in this spectrum your situation is. – whuber Sep 02 '14 at 05:38
  • Also, if you provide details of the objective function it would be clear whether the function f is smooth. – seanv507 Sep 02 '14 at 08:11
  • @whuber : the histogram is of the values $f_i(x) = f(x) + \eta_i$ for a *fixed* $x$, but for $i=1.\ldots,1000$. Since the minimal $f_i(x)$ is 0.0588, clearly $f(x)\leq 0.0588$. It is intended to show the noise as requested by Kirill in an earlier comment. – J.J. Green Sep 02 '14 at 18:53
  • @seanv507 : the function $f$ is rather difficult to describe. In brief it is the minimal value of a complex bivariate polynomial at a distance $x$ in a particular direction away from its maximum value on the complex ball -- the minimum taken over all polynomials of a given order whose maximum modulus is one. *A priori*, the function is non-increasing, but it is not obvious that it is continuous. – J.J. Green Sep 02 '14 at 19:01
  • @Kirill was asking for a "noisy graph of the function." This is important to examine because the possibility of solving this problem depends on the noise relative to the variability in the function itself. – whuber Sep 02 '14 at 19:02
  • @Kirill : I have tried sampling on a uniform grid, then fitting a low-order polynomial which is below all of the sampled points (but as large as possible), and then finding the root of that polynomial. This gives results that look reasonable, but I would like more accuracy and was hoping to find a better method. – J.J. Green Sep 02 '14 at 19:32
  • So maybe I am talking garbage, but I think you should be able to show smoothness of the function:effectively you need to be able to specify a lagrange multiplier problem and show that the lagrange function is diff wrt x? then use implicit function theorem ( I've seen this for geodesics - still don't understand your function) – seanv507 Sep 02 '14 at 22:24

0 Answers0