This is pretty hard for me to describe, but I'll try to make my problem understandable. So first you have to know that I've done a very simple linear regression so far. Before I estimated the coefficient, I watched the distribution of my $y$. It is heavy left skewed. After I estimated the model, I was quite sure to observe a left-skewed residual in a QQ-Plot as wel, but I absolutely did not. What might be the reason for this solution? Where is the mistake? Or has the distribution $y$ nothing to do with the distribution of the error term?
Asked
Active
Viewed 6,062 times
12
-
@Aniko gives a [nice answer](http://stats.stackexchange.com/questions/11315/how-does-the-distribution-of-the-error-term-affect-the-distribution-of-the-respon/11316#11316) in response to your previous question. – whuber May 29 '11 at 21:17
2 Answers
24
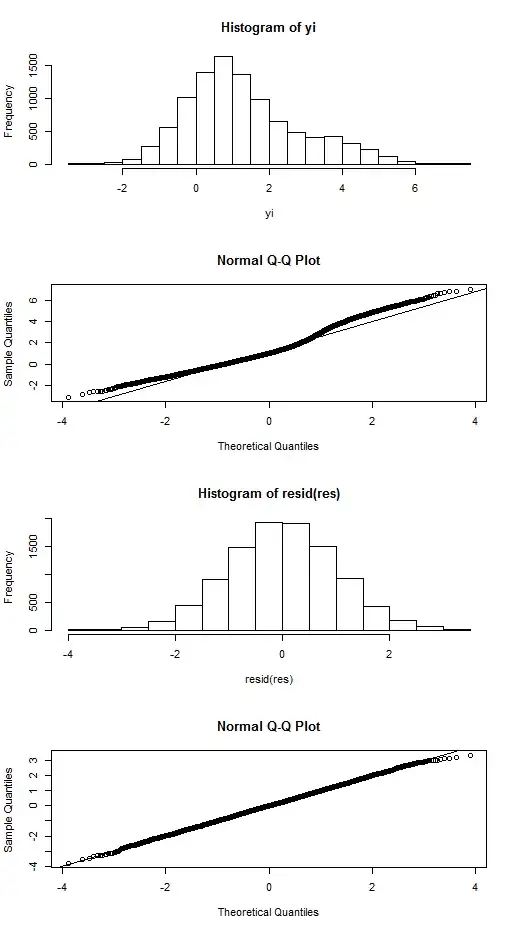
To answer your question, let's take a very simple example. The simple regression model is given by $y_i = \beta_0 + \beta_1 x_i + \epsilon_i$, where $\epsilon_i \sim N(0,\sigma^2)$. Now suppose that $x_i$ is dichotomous. If $\beta_1$ is not equal to zero, then the distribution of $y_i$ will not be normal, but actually a mixture of two normal distributions, one with mean $\beta_0$ and one with mean $\beta_0 + \beta_1$.
If $\beta_1$ is large enough and $\sigma^2$ is small enough, then a histogram of $y_i$ will look bimodal. However, one can also get a histogram of $y_i$ that looks like a "single" skewed distribution. Here is one example (using R):
xi <- rbinom(10000, 1, .2)
yi <- 0 + 3 * xi + rnorm(10000, .7)
hist(yi, breaks=20)
qqnorm(yi); qqline(yi)
It's not the distribution of $y_i$ that matters -- but the distribution of the error terms.
res <- lm(yi ~ xi)
hist(resid(res), breaks=20)
qqnorm(resid(res)); qqline(resid(res))
And that looks perfectly normal -- not only figuratively speaking =)
Wolfgang
- 15,542
- 1
- 47
- 74
-
"but the distribution of the error terms" You mean here residuals not error terms, right? More about residuals vs error: https://stats.stackexchange.com/questions/133389/what-is-the-difference-between-errors-and-residuals – vasili111 Nov 07 '19 at 14:33
9
With reference to the excellent answer from @Wolfgang, here are the plots from his R code:
Contango
- 1,387
- 1
- 16
- 15