I have a gender variable in my questionnaire, I have done it where 1= Male and 2= Female. I would like to correlate this variable with their answers to compare the difference between male opinions against female opinions. could someone help me with which correlation to run please and how to understand it.
Asked
Active
Viewed 260 times
0
-
2Is the output (or response), which I assume is opinion, a numerical variable or is it also categorical? – Dan Aug 27 '14 at 16:30
-
(almost) a duplicate: https://stats.stackexchange.com/questions/102778/correlations-between-continuous-and-categorical-nominal-variables/102800#102800 – kjetil b halvorsen Apr 18 '20 at 20:57
2 Answers
0
Have you considered using graphical solutions to show there is a correlation? Something as simple as a box plot would probably convey what you want. For example, an illustration as simple as the following
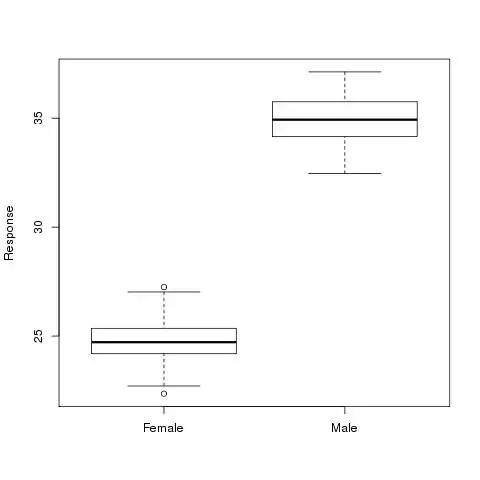
would clearly show that there appears to be a correlation between opinion and gender. These type of solutions don't give a numerical value for the correlation (although I am unaware of a correlation measure for categorical variables) but they still make the point that you want.
Dan
- 964
- 6
- 15
-
-
For ordered categories, which I expect "opinion" will be, you might use something like [this](http://i.stack.imgur.com/yJhWA.png) or [this](http://i.stack.imgur.com/U7a4i.png) ... or a pair of barcharts, perhaps. – Glen_b Aug 28 '14 at 00:53
0
Do you have a specific reason that you want to use correlation? If you're just interested in determining whether the two groups differ, you could simply use a chi square test or t-test, depending on how your variables and data look. This approach would be useful if you wanted to show that men and women differed in their average opinion ratings.
If you are specifically interested in using a correlation and your outcome variable is continuous, then a point biserial correlation would be appropriate. You would calculate this in the same way as a standard Pearson correlation, and your interpretation would be based on how you coded your sex variable. If, for instance, you coded your sex variable as male=0 and female=1 and found a positive correlation between sex and opinion, then you would interpret this as meaning that females tended to have higher opinion scores (e.g., as sex "increased" from 0/male to 1/female, so did opinion scores).
Katherine S
- 76
- 4