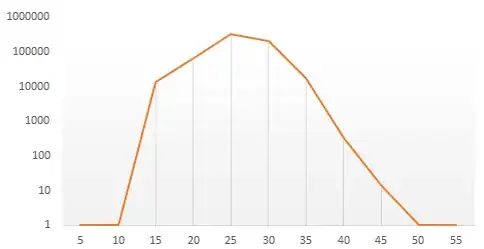
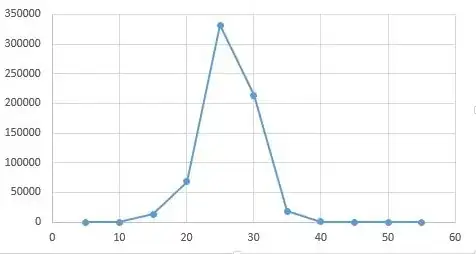
I have an array dataset of about 650.000 points. I want to test if the dataset follow a normal distribution or any other distribution. The first thing I did was to split the data in groups, find the frequency of each one and then create a simple chart. Here is the result:
LogY axis:
Normal axis:
Then, I tried to apply a statistic package in Python for Hypothesis null.
The first one: Link 1 with result (26576.286833062259, 0.0)
The second one: Link 2 with result (1.0, 0.0)
Both of them have p-value equal to zero which means that the data doesn't follow a normal distribution. Do you think that that this is valid or am I doing something wrong?
I tried it also with all the different distributions from this link and here is the results:
anglit (1.0, 0.0)
arcsine (1.0, 0.0)
cauchy (0.97256179317853242, 0.0)
cosine (1.0, 0.0)
expon (0.99998329829920973, 0.0)
gilbrat (0.99251782771674257, 0.0)
gumbel_r (0.99998329843868239, 0.0)
gumbel_l (1.0, 0.0)
halfcauchy (0.94812454120633505, 0.0)
halflogistic (0.99996659715630376, 0.0)
halfnorm (1.0, 0.0)
hypsecant (0.9999893673670458, 0.0)
kstwobign (1.0, 0.0)
laplace (0.99999164914960492, 0.0)
logistic (0.99998329857815205, 0.0)
maxwell (1.0, 0.0)
norm (1.0, 0.0)
rayleigh (1.0, 0.0)
semicircular (1.0, 0.0)
uniform (1.0, 0.0)
wald (0.99981187008374384, 0.0)