3

I want to create a plot that overlays a heavy vs light tailed distribution as an example and am trying to figure out the best way to do this.

I can plot gamma distribution which is light tailed and a pareto, which is heavy but they are inherently different. As such, they are somewhat hard to compare? Any suggestions of what two distributions make a good picture?

Thanks!
user1357015
  • 1,404
  • 5
  • 16
  • 26

2 Answers2

7

Log-log plot is your best choice. Here's an image of mine from this tutorial. Top is linear scale for both, and bottom image is log-log. Notice how the tails are indistinguishable in the linear plot but very clearly different in the log-log plot.

From tutorial

As for R, the following web page describes how to set ggplot2 to use log-log scales: http://docs.ggplot2.org/current/scale_continuous.html

MrMeritology
  • 1,164
  • 6
  • 10
3

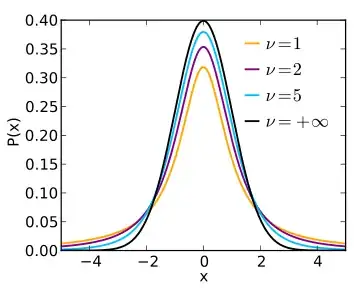
I think you are asking for 2 different distributions that share some common 'essence', but that differ in how heavy their tails are, so that when you plot them the nature of 'heavy-tailedness' can be demonstrated. Is that correct? If so, why not use the $t$ distribution with $1$ and $\infty$ degrees of freedom? Here is a plot of several $t$ distributions from the Wikipedia page:

enter image description here

gung - Reinstate Monica
  • 132,789
  • 81
  • 357
  • 650