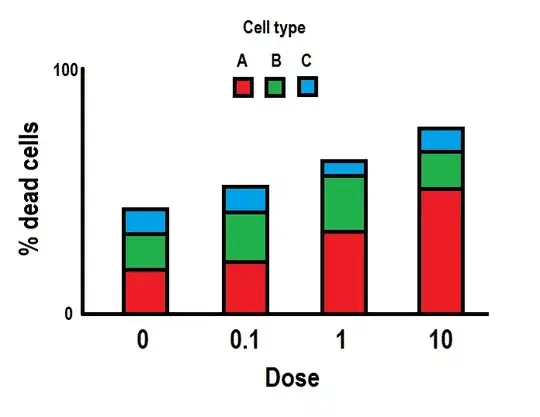
Maybe what you want to test here is probably this: "are Dose and Type independent?"
$\chi^2$ Test of Independence
Since we know the sample size $N$ we can conduct a $\chi^2$ test of independence.
This is our observed fractions (per dose)
         dose
cell.type     0 0.1    1   10
        A 0.080 0.1 0.06 0.10
        B 0.135 0.2 0.22 0.15
        C 0.165 0.2 0.32 0.50
Since there there are 8000 observations per dose, we get the following observed values
         dose
cell.type    0  0.1    1   10
        A  640  800  480  800
        B 1080 1600 1760 1200
        C 1320 1600 2560 4000
Assuming independence, we'd expect to get these values (it's row total times column total divided by overall total for each cell)
         dose
cell.type    0  0.1    1   10
        A  463  610  732  915
        B  961 1265 1517 1897
        C 1615 2126 2551 3188
So we compare them, calculate the $X^2$ statistics and calculate the $p$ value, which, in this case, is very low ($\approx 10^{-16}$).
Thus, we reject the independence hypothesis and conclude that they cannot be independent.
Caveat:
- the sample size is very big (8000) - which results in a too small $p$ value (see more here)
R code
data_raw = c(0.080, 0.1, 0.06, 0.10,
0.135, 0.2, 0.22, 0.15,
0.165, 0.2 ,0.32, 0.50)
tbl = matrix(data=data_raw, nrow=3, ncol=4, byrow=T)
dimnames(tbl) = list(cell.type=c('A', 'B', 'C'),
dose=c('0', '0.1', '1', '10'))
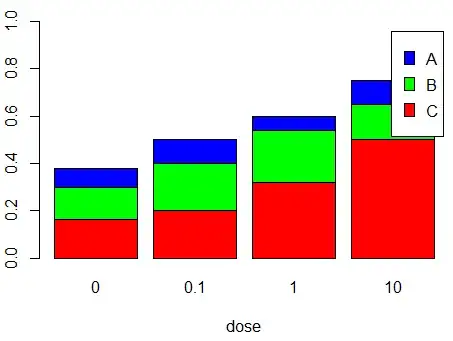
barplot(apply(tbl, 2, rev), col=c('red', 'green', 'blue'),
ylim=c(0, 1), xlab='dose',
legend.text=rev(c('A', 'B', 'C')))
N = 8000
observed = tbl * N
chisq.test(observed)
References