I am having trouble understanding the output here. In the green table, it seems like SAS is saying "Gender F" and "Gender M" are not significant. However, in the blue table, seems like it's saying that it would make a different if we just exclude the variable Gender. I am a bit confused because these two conclusions seem contradictory to each other. Any idea?
Asked
Active
Viewed 263 times
2
-
Related: [1](http://stats.stackexchange.com/questions/83030/can-anova-be-significant-when-none-of-the-pairwise-t-tests-is) – Affine Aug 07 '14 at 20:08
-
Is the green table only a subset of a full table that includes all the predictors also found in the blue table? If so, I will update my answer accordingly. – Patrick Coulombe Aug 07 '14 at 20:19
-
@PatrickCoulombe No it's not a subset. I just didn't include the original green table because it is huge. I have 29 levels for "state". – 3x89g2 Aug 07 '14 at 21:06
-
@Misakov but your analysis DID include the other predictors, is that it? You've simply removed the lines from the table, but all the predictors were included when estimating the gender effects, correct? – Patrick Coulombe Aug 07 '14 at 21:08
-
@PatrickCoulombe Yes, I did include the other predictors. – 3x89g2 Aug 07 '14 at 21:17
-
@Misakov I updated my answer. – Patrick Coulombe Aug 07 '14 at 21:19
1 Answers
1
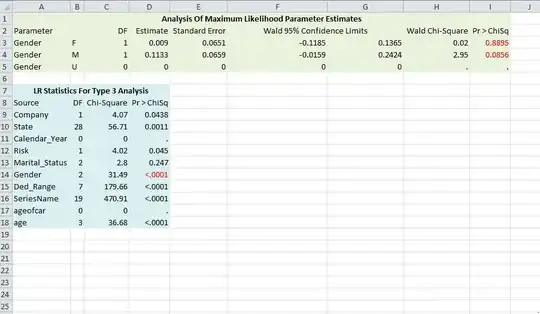
In the green table you're comparing the average of men and of women to the average of the third category in the Gender variable ("U"). Maybe there's a difference between men and women but not between either men or women and the U category (esp. if the sample size of the "U" is small). The test for gender in the blue table is a 2-degree-of-freedom test, whereas each test in the green table is a 1-degree-of-freedom test.
In other words, they're not the same tests at all. The green table tests the average difference between Men and U, and between Women and U; the blue table tests the increase in model fit when adding the gender variable to your model (i.e. whether adding gender to your model increases the accuracy of your predictions).

Patrick Coulombe
- 2,536
- 6
- 20
- 28
-
1I presume the green table is probably a subset of the full parameter estimates (re: second paragraph) – Affine Aug 07 '14 at 20:08
-
@Affine it does sound like it, thanks for pointing that out. I updated my answer. – Patrick Coulombe Aug 07 '14 at 21:11
-
So if I want to decide which variables to include in my model, I should refer to the blue table. Is that correct? – 3x89g2 Aug 07 '14 at 21:52
-