6

I'm working with data from an instrument which is expected a priori to produce Gaussian (normally) distributed data:

\begin{equation} G = A\exp\left(-\dfrac{(x - \mu)^2}{\sigma} \right) \end{equation}

The data are normally sparse, with only about 2-3 measurements representing each $G$. In this question, I'm focussing on a single $G$, but in reality, we often have analyte signals causing overlapping $G$ that are then fitted simultaneously as described below.

To fit $G$ to our measurements, we calibrate for $\mu$ and $\sigma$ a priori using reference signals, then use these calibrations to constrain all parameters except $A$. So the fit reduces to

\begin{equation} G = AG_0 \end{equation}

which is then fitted by least-squares minimization to determine $A$.

My main question is: what is the uncertainty ($\sigma_A$) in the fitted $A$?


My initial approach was to estimate $\sigma_A$ as the RMSE of the fit. But since the RMSE is essentially the standard deviation of the residuals, this seems like an overestimate: I want the confidence interval of the fitted parameter.

Can I safely use the following textbook equation for the confidence interval of a linear-regression slope in this context? (the $x_i$ are the predictor variables, $\bar{x}$ is the mean of the predictor variables, the $e_i$ are fit residuals, and 2 degrees of freedom were consumed by the 1 fitted variable and the fact that the residuals sum to zero)

\begin{equation} \sigma_A = \dfrac{s_e}{\Sigma _i (x_i - \bar{x})^2 } = \dfrac{\frac{1}{n- 2}\Sigma_i e_i^2}{\Sigma _i (x_i - \bar{x})^2 } \end{equation}

I think "yes": all I have done is transform my $x$ before fitting a linear parameter. I also think "no" because I'm not sure of the meaning of $x_i - \bar{x}$ in this equation -- is it specific to linear regression?


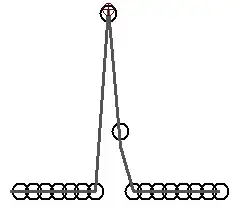
To give you a visualization, my data are almost as bad as these simulated data (but often the signal ontains one or two data points more):

A gaussian fit to only 2 data

Note: I am aware that Bayesian analysis would be a better method for passing information about $\mu$ and $\sigma$ to my fit, but I am not at liberty to change the analysis software right now. I need to limit myself to an estimate of $\sigma_A$.

edit: Another note that might exclude some solutions: I am analyzing thousands of measurements in bulk with no known true value.

Jeff T.
  • 61
  • 2

1 Answers1

1

Jeff,
Two comments.
1) The steps you described correspond to fitting the model: \begin{equation} G_i = AG_0(x_i) + \epsilon_i \end{equation}
with {epsilon_i} iid, normally distributed, with mean 0 and variance sigma, which is a standard linear model (linear in the way the observations are assumed to depend on the un-known parameter A), without intercept.
The least-square estimator is \begin{equation} \hat A = \dfrac{\Sigma _i G_i G_0(x_i)}{\Sigma _i G_0(x_i)^2 } \end{equation}
whose variance can be estimated by
\begin{equation} se^2(\hat A) = \dfrac{\frac{1}{n- 1}\Sigma_i e_i^2}{\Sigma _i G_0(x_i)^2 }. \end{equation}
There would be an \bar{x} if the model had an intercept.

2) It seems, from what you say, that to reflect the uncertainty in A, a model of the form:
\begin{equation} ln(G_i) = a + ln(G_0(x_i)) + \epsilon_i \end{equation}
would be better. One could fit the constant a, taking the ln(G_0(x_i)) term as a fixed offset, and translate the uncertainty in the estimator of a into uncertainty in A.

VictorZurkowski
  • 349
  • 2
  • 9
  • Thank you! So (if I understand correctly) it was true that any transformation of the $x$ variable, followed by a linear fit, can be afterwards analyzed by standard least-squares approach. However, I don't understand why you suggest switching from my physically-based Gaussian approach, to your log-transformation approach? Why have you chosen a logarithmic function? To represent a more general form of the exponential Gaussian function? – Jeff T. Aug 06 '14 at 08:34
  • The log transformation is just a suggestion. Ordinary least squares in the original scale would assume that {epsilon_i} have the same variance, but G0 and G_i decrease very fast; the assumption that errors for observations in the tails are of the same size as around \mu would not hold. You can still work in the scale of the G's; the estimator would be the BLUE estimator; use of the least-squares machinery (p-value computations, confidence intervals, etc) would not be justified since a key assumption underlying those results (equal variance of the remainders) would not be true. – VictorZurkowski Aug 14 '14 at 18:28
  • Note that the log transformation also effectively changes the weighting of the data points in the least-squares minimization. Equal weights in linear scale correspond to equal absolute uncertainty, while equal weights in log scale correspond to equal _relative_ uncertainty in linear scale. – Dave Kielpinski Oct 18 '17 at 17:24