4

I'm trying to use central limit theorem to compute the mean of the sample, however the population where I'm sampling has value only between 0 and 1, can I use mean of the sample as mean of the population and standard error = (population's standard error / sqrt(n))?

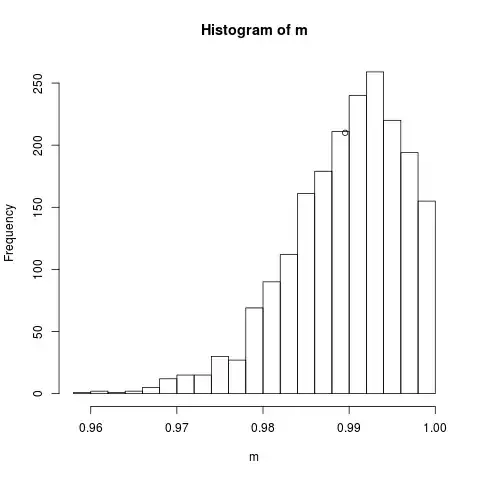
I have done it, but the distribution does not seem a Normal, for example, I have a population with mean = 0.9895348 and SD = 0.05908021, then I'm assuming that mean of the sample should be 0.9895348 and for a sample of n = 78 the SD of the sample mean = 0.006689516.

I sampled 2000 times a random sample of n = 78, and the histogram I attached below. It does not seems a Normal, and the mean seems to be on the left where it should be, and the SD seems to be greater than 0.006689516.

enter image description here


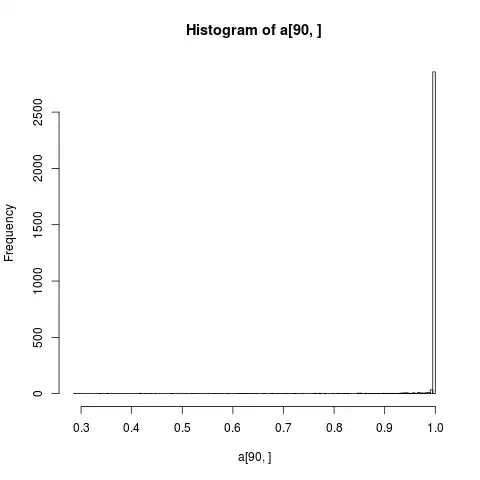
Edit: What I want is the best way to calculate the expected value of mean of a random sampling from this population. When the mean is close to 0 or 1, in my opinion, the expected value does not seem fine. When it is close to 0 the expected value seems to be greater than it should be, and when it is close to 1 it seems to be lower than it should be.

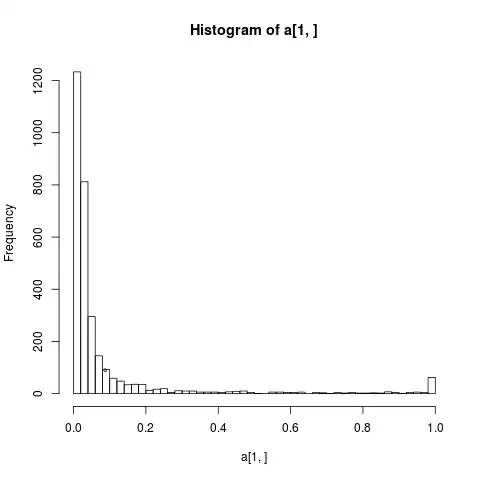
It is a synthetic dataset, where every point has a probability, below has a histogram of the data: enter image description here

Another dataset, when the mean is close to 0, here the mean is ploted as a point, but I think the expected value should be lower

enter image description here

user53064
  • 111
  • 1
  • 7
  • What exactly do you need the sampling distribution of the mean for? Note that the CLT does not guarantee the sampling distribution of any finite sample must be normal, it has to do with the distribution to which the sampling distribution will converge 'at infinity'. It is possible that the required N for the CLT to have 'kicked in' sufficiently to be surprisingly high (see [here](http://stats.stackexchange.com/a/29748/)). Strictly speaking, if the data cannot go beyond (0,1), then the mean cannot & so the sampling dist cannot ever be truly normal, since that goes to infinity. – gung - Reinstate Monica Jul 30 '14 at 02:20
  • @gung Please! The CLT does not say that sampling distribution of the _mean_ converges to a normal distribution _even if_ all the samples are drawn from a normal distribution (except in the trivial sense that a constant can be thought of as a normal random variable with zero variance). – Dilip Sarwate Jul 30 '14 at 02:27
  • What makes you say the mean should be higher when the values in the histogram are mostly near 1, and lower in the last one, where they're mostly near 0? If I had 99 0's and a 1, where *should* the mean lie, do you think? – Glen_b Jul 30 '14 at 12:47

2 Answers2

1

Nope, I'd say that's definitely not normal! Keep in mind that the CLT is asymptotic, so the sample means will converge to the population mean only as the number of samples approaches infinity. Especially in the case of a skewed distribution, you will need a large sample for the sampling distribution to appear normal. Likewise, as @gung writes, the normal distribution is defined over the real line. Since your data are constrained between 0 and 1, the mean can never exceed 1 or fall below 0, so this will be an approximation.

A few things to consider:

  1. Are your data proportions? If so, it might be more informative to consider them as the outcome of binomial trials, with some unknown probability of success.

  2. The beta distribution is often used to characterize the distribution of probabilities. It is constrained to values between 0 and 1, and can be skewed, symmetric, or bimodal.

  3. Sometimes people take logarithms to spread out strictly positive values. Since your values are constrained between 0 and 1, you can even avail yourself of the logistic transformation, which is defined as the log odds: $$f(x)=\log(\frac{x}{1-x})=\log(x)-\log(1-x)$$ Taking the log of values between 0 and 1 will produce a negative number; however, the logistic function can return values on the whole real line, so a normal-appearing distribution of $f(x)$ is not out of the question.

Ultimately, it's hard to answer this question without knowing what you want to accomplish. What is your ultimate quantity of interest? What kind of question are you trying to answer?

Sycorax
  • 76,417
  • 20
  • 189
  • 313
1

(Several edits here. It now seems to be reasonably clear you're not talking about counts.)

With the mean $\approx 0.99$, a normal approximation for the sample proportion may not be very good until $n$ is somewhere up perhaps in the region of $1000$ to $1500$ or so (e.g. if you have lots many values that are effectively $1$'s and a very few small values, it could take about that many observations)

Can you show us what your simulation consisted of? What did you sample from?

Glen_b
  • 257,508
  • 32
  • 553
  • 939