19

I have looked at a lot of R datasets, postings in DASL, and elsewhere, and am not finding very many good examples of interesting datasets illustrating analysis of covariance for experimental data. There are numerous "toy" datasets with contrived data in stat textbooks.

I'd like to have an example where:

  • The data are real, with an interesting story
  • There is at least one treatment factor and two covariates
  • At least one covariate is affected by one or more of the treatment factors, and one is not affected by treatments.
  • Experimental rather than observational, preferably

Background

My real goal is to find a good example to put in the vignette for my R package. But a larger goal is that people need to see good examples to illustrate some important concerns in covariance analysis. Consider the following made-up scenario (and please understand that my knowledge of agriculture is superficial at best).

  • We do an experiment where fertilizers are randomized to plots, and a crop is planted. After a suitable growing period, we harvest the crop and measure some quality characteristic - that's the response variable. But we also record total rainfall during the growing period, and soil acidity at time of harvest -- and, of course, which fertilizer was used. Thus we have two covariates and a treatment.

The usual way to analyze the resulting data would be to fit a linear model with the treatment as a factor, and additive effects for the covariates. Then to summarize the results, one computes "adjusted means" (AKA least-squares means), which are predictions from the model for each fertilizer, at the average rainfall and the3 average soil acidity. This puts everything on an equal footing, because then when we compare these results, we are holding rainfall and acidity constant.

But this is probably the wrong thing to do -- because the fertilizer probably affects the soil acidity as well as the response. This makes the adjusted means misleading, because the treatment effect includes its effect on acidity. One way to handle this would be to take acidity out of the model, then the rainfall-adjusted means would provide a fair comparison. But if acidity is important, this fairness comes at great cost, in the increase in residual variation.

There are ways to work around this by using an adjusted version of acidity in the model instead of its original values. The upcoming update to my R package lsmeans will make this downright easy. But I want to have a good example to illustrate it. I will be very thankful to, and will duly acknowledge, anyone who can point me to some good illustrative datasets.
Russ Lenth
  • 15,161
  • 20
  • 53
  • 1
    While this is no doubt both an important and interesting question, it seems as if it might fall foul of the rules about what's [on topic](http://stats.stackexchange.com/help/on-topic): "*Questions about obtaining particular datasets are off-topic (they are too specialized).*" – Glen_b Jul 29 '14 at 00:37
  • Ok, my apologies. I had read that page before, but guess it didn't sink in. On re-reading it, I have to agree that it isn't the kind of question sought here. I'll delete it in a little while, once I make sure you get this response. – Russ Lenth Jul 29 '14 at 01:21
  • I have seen it now. But if you're unsure of whether your post is covered by that (I could be wrong, after all - I often am), try a post about it on meta.stats.stackexchange (with a link to this Q) before you delete. Users and mods will be happy to discuss their take on it. We don't have to rush it; it's not going to do any harm if it sticks around for a day. – Glen_b Jul 29 '14 at 01:30
  • To expand on that -- there are aspects of your question that make me less than 100% certain about this one, which is why I commented and phrased it with "seems" and "might" rather than simply voting to close, and why I suggest taking it to meta. I think it's probably off topic, but if you're unsure, get some more opinion. – Glen_b Jul 29 '14 at 01:39
  • OK. I did that, and we'll see what happens. Thanks for your guidance – Russ Lenth Jul 29 '14 at 01:50
  • 3
    The meta-question: [Not-a-particular dataset request - still not kosher?](http://meta.stats.stackexchange.com/q/2122/32036) – Nick Stauner Jul 30 '14 at 04:46
  • @NickStauner, thanks for linking the meta question. I should have thought to link it the other way. – Russ Lenth Jul 30 '14 at 13:28
  • I'm going to leave this question up for at least a while more. The responses to the meta question so far have not been giving me a clear message that I should delete it. – Russ Lenth Jul 30 '14 at 13:31
  • 1
    My impression of the responses so far is that we're cautious to give other questions like this a blank check by ruling firmly in favor of it, but that we're mostly in favor of this particular question and even a little eager to see what kinds of answers you might get (maybe that bit is just me). What we wouldn't want is poorly written knockoffs of this question that ask for datasets with which to prove points *with* statistics but not *about* statistics. I.e., it's one thing to ask for help in demonstrating a statistical principle, but it would be another to ask for domain-specific datasets... – Nick Stauner Jul 30 '14 at 17:03
  • I agree with @Nick's interpretation. I think there's clear indication on meta that this question should stay. – Glen_b Jul 30 '14 at 19:01
  • @RussLenth: This is a great candidate for a **bounty** since it would probably require a fair bit of research on behalf of the answerer (but don't be cheap--something like **200** points would probably be fair). – Steve S Jul 31 '14 at 21:31
  • 3
    OK, sounds like a good idea. I've done far worse things in the past to lower my reputation... – Russ Lenth Jul 31 '14 at 21:43
  • 2
    @SteveS I agree it's a good candidate for a bounty; indeed I just came here to *put one on it myself*, only to discover Russ had done so already. If there aren't some good answers in a week, I might consider putting a second bounty on it. Russ: bounties on interesting questions tend to attract enough attention that the ensuing upvotes often almost pay for them anyway, so the reputation loss often is a lot less steep than it seems at first glance. – Glen_b Aug 01 '14 at 01:46
  • @RussLenth: Great move--especially because this is the type of question that a lot of people can participate in since it doesn't require some sort of deep, arcane knowledge base, only a fair bit of digging... I'm really looking forward to the results of this bounty and the resulting **vignette**! – Steve S Aug 01 '14 at 02:33
  • What about the **Tennessee STAR experiment** from the 1980s--is that something that would fit the bill? [If it does then I'll write a proper (longer) answer...]. – Steve S Aug 01 '14 at 02:38
  • FWIW, I wanted to get the update on CRAN before JSM, so in ver.2.11 I use the feedlot example in Urquhart's 1982 paper. It serves OK, but I think a better, more appealing example is possible. – Russ Lenth Aug 01 '14 at 02:43
  • Russ, did you want a second bounty on this question? Or are you happy with what you have? – Glen_b Aug 08 '14 at 07:59
  • Glen - I'm happy with the responses I have. Do people often repeat a bounty? Or maybe I should ask if you were about to chime in with your own answer? – Russ Lenth Aug 08 '14 at 12:10

4 Answers4

6

You may want to check out the mediation R package. It does include experimental data like jobs and framing where the treatment variable affects both a response variable and covariates (i.e., mediators of the treatment effect), along with covariates not affected by the treatment.

I looked into the mediation literature because I though you exactly described a mediation study: the fertilizer effect on the crop quality is mediated through its effect on soil acidity. Even if the datasets in the mediation package do not satisfy you, you may find one if you look into the mediation literature.

Masato Nakazawa
  • 1,702
  • 7
  • 9
  • Thanks. I installed the package and will look at it. And an opportunity to learn something new. – Russ Lenth Aug 01 '14 at 13:48
  • Interesting that the jobs data was mentioned in two of three talks in a JSM session I just attended... – Russ Lenth Aug 04 '14 at 14:01
  • 1
    Well, I wish I could split the bounty somehow. But this package does have ready datasets that are very suitable to what I asked, so @MasatoNakazawa gets the bounty. Thanks so much. Using the `framing` data, interaction plots of LSmeans (based on a logistic model) when the mediating variable are held fixed are dramatically different from those where it is set to values predicted by treatments and other covariates, thus showing how important it is to take the mediating variable into account. – Russ Lenth Aug 06 '14 at 23:43
  • 1
    Thank you Dr. Lenth. Actually I have cited your articles in my dissertation. I am honored I was in any way able to be of help to an established statistician like you. – Masato Nakazawa Aug 07 '14 at 01:56
4

I thought I'd show how an analysis comes out with one of the datasets in the mediation package. In framing, an experiment is done where subjects have the opportunity to send a message to Congress regarding immigration. However, some subjects (treat=1) were first shown a news story that portrays Latinos in a negative way. Besides the binary response (whether or not they sent a message), we also measured emp, the subjects' emotional state after the treatment was applied. There are various demographic variables as well.

First, let's load the needed packages in R, and change the labels for educ to shorter strings.

> library("lsmeans")
> library("mediation")
> levels(framing$educ) = c("NA","Ref","< HS", "HS", "> HS","Coll +")

Now fit a logistic regression model

> framing.glm = glm(cong_mesg ~ age + income + educ + emo + gender * factor(treat),
+                   family = binomial, data = framing)

Here is a display of the conventional adjusted means, where predictions are made with the covariates age, income, and emo set at their mean values:

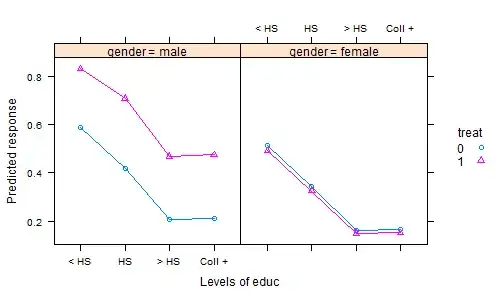
> lsmip(framing.glm, treat ~ educ | gender, type = "response")

(Interaction plot of conventional "adjusted means", transformed to the response scale)

This is a curious result because the displayed treatment effects are the opposite for females as for males, and the effect of education isn't monotone as one might expect.

Note, hHowever, emo is a post-treatment measurement. This means that the treatment could have affected it, i.e. emo is a mediating covariate; and so it may not be meaningful to compare predictions of the response variable while holding emo constant. Instead, let's look at the predictions where emo is set to its predicted values given treat and the demographic variables.

> lsmip(framing.glm, treat ~ educ | gender, type = "response",
+       cov.reduce = emo ~ treat*gender + age + educ + income)

(Interaction plot of predictions taking mediating effects into account)

This result is quite different, suggesting that emo plays a strong mediating role. (The mediation package has functions for estimating the strength of these effects.) The above predictions suggest that, taking emotional response into account, male subjects exposed to the negative news story are more likely to send the message than are females or those not seeing the negative news story. Also, the effect of educ is (almost) monotone.

Thanks again to @MasatoNakagawa for pointing me to this interesting example and attuning me to some recent research on causality.

Russ Lenth
  • 15,161
  • 20
  • 53
3

Look up gene-environment interaction GWAS studies. The statistical analysis they perform in essence is what you have described. The question is does your environment matter to a phenotype (observable feature)? One school of thought generally ignores all environmental information and says your genetic makeup describes your phenotype. This is in complete contrast with ecological studies where the story is environment is everything and they ignore the genes. Since both parties are trying to understand the same problem, there have been recent attempts to coalesce the two.

Say we are studying BMI. We take the first few principal components of the genetic matrix as the fixed effects due to genes. We fit education with an index 1 for well educated and 0 for poorly educated as a fixed effect. There is a reasonably strong correlation between the education index and wealth of the community the person is from. So one would argue that the low income communities are more likely to have more fast food restaurants. The fast food acts as an obesogenic trigger.. "Triggers something in your genetic setup which encourages fat accumulation" so it will show up in the genetic makeup in some form.

Simulating such data is not a problem. Look up

http://pngu.mgh.harvard.edu/~purcell/plink/simulate.shtml

This lets you simulate GWAS (think of this as genetic units) data responsible for a symptom. If not instructed otherwise it will generate 1000 with the symptom and 1000 controls. The norm in these simulations which I use is 9990 SNPs do not cause the symptom and 10 SNPs do. Read the instructions on how these are simulated.

The output will be 1 if the person is obese and 0 if he isn't. Simulate education factors (finished college eduction/not finished college education )based on some reasonable correlation with obesity levels.

Hope this helps!!!

Sid
  • 2,489
  • 10
  • 15
  • Thanks. Still holding out for some real data though... Plus I'm not sure what a GWAS study is. DUH, just found out by following the link. – Russ Lenth Aug 01 '14 at 01:17
  • Even though I gave the bounty to another respondent, I do appreciate this suggestion and intend to follow through with it. Thanks. – Russ Lenth Aug 06 '14 at 23:45
1

I'd recommend reading Freakonomics, and finding the papers their work is based on, and seeing if you can grab that data. They have some really interesting work on really interesting datasets, and in some cases they figure out very clever ways to test hypotheses despite limitations in the data.

Nir Friedman
  • 222
  • 1
  • 5