Going to preface my answer with this: the procedure I describe below is NOT a valid model selection procedure... It is an exploratory tool.
How do I choose which to apply in my regression formula?
Unless there is reasoning based on findings in your field, usually the analyst can only guess what relationships may exist. One way to do this is to throw all sorts of non-linear transformations into the regression model to see how well they do in explaining the output variable.
However, plotting the data can be extremely useful here. Consider a model given precisely by
$$
Y \sim \mathcal{N}(\mu, \sigma^2),\\
\mu = \beta_0 + \beta_1X_1 + \beta_2 X_2 + \beta_3\log(X_3).
$$
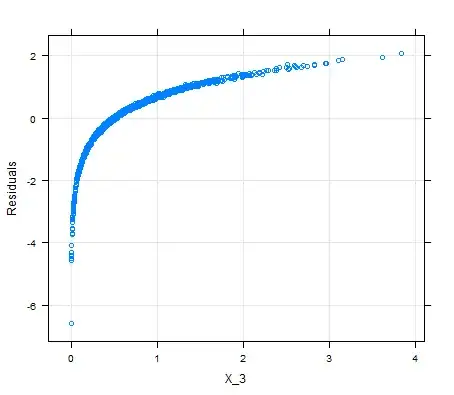
If we suspect there is a nonlinear transform for $X_3$ that will help us model $Y$, then we can run a regression on $Y$ against just $X_1, X_2$ and look at the residuals. The residuals are the errors of the model (i.e., $y - \hat y$), so they represent how far off just using $X_1, X_2$ is. In this case, we would expect $y - \hat y \propto \log(X_3)$ because of the formula for $\mu$:
$$
\mu = \beta_0 + \beta_1X_1 + \beta_2 X_2 + \beta_3\log(X_3) \implies \mu - (\beta_0 + \beta_1X_1 + \beta_2 X_2) = \beta_3\log(X_3)
$$
Plotting the residuals, we observe a log trend in $X_3$.
So we plot $\log(X_3)$ against the residuals and get a clearly linear trend.
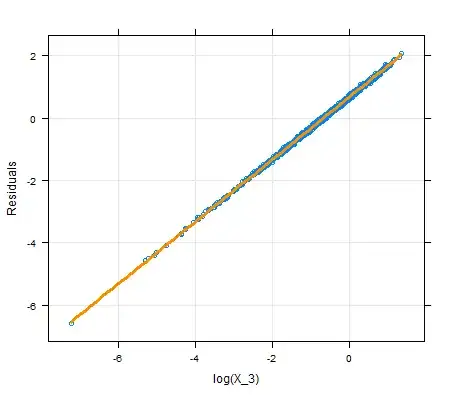
Just plotting $X_3$ against $Y$ might not be that useful, since we wouldn't necessarily be able to uncover this trend without controlling for $X_1, X_2$. This approach allows you a better chance to uncover $X_3$'s involvement in predicting $Y$.