I've written a small hierarchical clustering algorithm (for better or for worse). I'd like a quick way of visualizing it, any tooling ideas?
Asked
Active
Viewed 4,635 times
4 Answers
5
TreeView -- it is not a statistical tool, but it is very light and I have a great sentiment to it; and it is easy to make output to Newick format, which TV eats without problems.
More powerful solution is to use R, but here you would have to invest some time in making conversion to the dendrogram object (basically list-of-lists).
-
Unfortunately TreeView has given me a wonderful buffer overflow error :(. – Hans May 16 '11 at 04:56
-
@Hans Strange; unless you're trying to plot something huge, it should have worked. Are you sure the format is OK? – May 16 '11 at 07:23
-
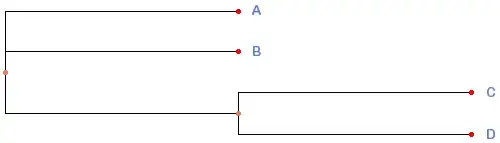
Perhaps not. My example.tre file: (A,B,(C,D)); – Hans May 17 '11 at 04:18
-
@Hans All I can say is that it works for me :-( – May 17 '11 at 16:45
2
You can use PhyFi web server for generating dendrograms from Newick files. Sample output using your data from PhyFi:
Khader Shameer
- 663
- 1
- 7
- 14
2
Archaeopteryx is a Java application that you can use standalone or embed in an application. Dendroscope is also pretty good. Both can read files in Newick format, and provide many ways of manipulating the display.
kc2001
- 215
- 1
- 9
0
While it's not a tool per-se, ascii art is a fairly safe option actually, and not as hard as it seems at first. It's not pretty, but it gets the point accross.
Hans
- 163
- 1
- 4