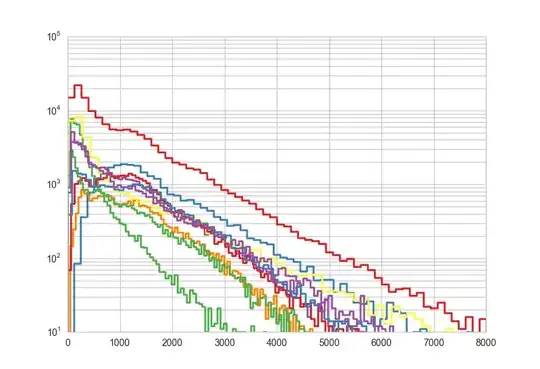
The exponential distribution is a special case of the gamma distribution - if you play around with gamma distribution parameters, I think you can probably get pretty close to the shape you're looking for.
I have asked a question about fitting in general before, and got some helpful answers. I have also found Vose's list of probability distributions useful as a first step, although I try to avoid the obscure distributions unless I have the same data as the distribution was developed for (e.g., using a PERT distribution because I actually do have expert opinion data). What I have found most helpful, guideline-wise, is to:
- get more comfortable through practice with what distributions are useful for what types of data (example: the beta and gamma distributions are very flexible within their ranges, other not as much but are basically the default for certain situations)
- know when you can/cannot rely on assumptions (like deciding to use a normal even though your data only approximate a normal distribution)
- and then allowing yourself the flexibility to use your raw data when nothing gets even close to fitting what you have.
