I have data in the following form:
Day  Kurtosis    Skewness   Total Inflows
163     .3          .5        435670
I'm attempting to do some modeling of an inflow regime between a river and a reservoir. To do this, I need a simulated inflow regime based on observed data.
My original plan was to build a distribution based on a given kurtosis and skewness since I'm able to randomize those easily. The idea was that I could generate a curve from those two data points and the area under the curve to give me valid curves similar to the observed data. The resultant curve should look something like this (although there is significant variation year to year):
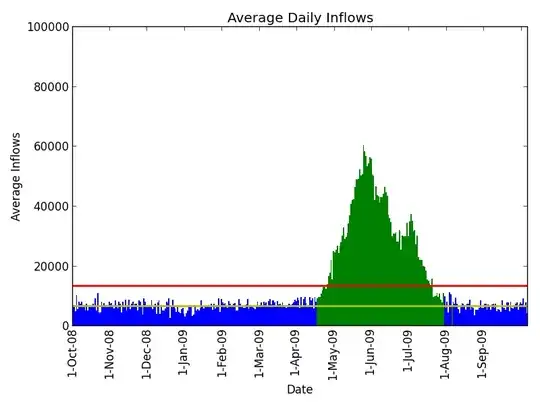
I can add the daily variation after the curve is created without issue (I think).
Unfortunately, I'm very new to the math and stats that are in play here, and I'm now unsure if it is possible to do anything with this data to give me fabricated curves. Does anyone know of a method for creating curves in this way? Alternatively, are there other methods that I might be able to employ to the same effect given different data?
I also have data for each (observed) year in the following form:
Date             Inflows
12-Oct- 2002     23000
with a similar entry for each day.