I am studying the definition of leverage, and I understand it in terms of formulas. However, if I would have a plot like this for instance, how could I see which of these points has the highest leverage? Which one would it be in this plot for instance?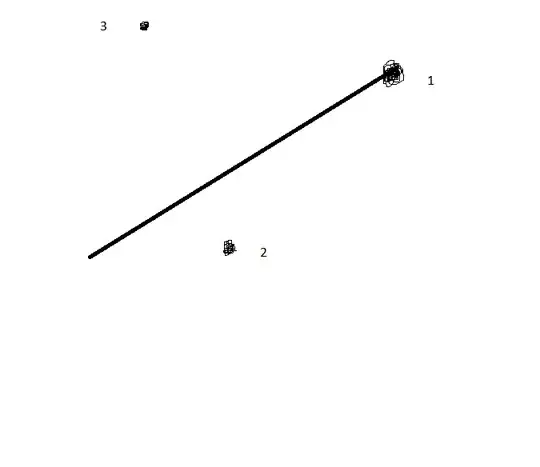
Asked
Active
Viewed 216 times
6
kjetil b halvorsen
- 63,378
- 26
- 142
- 467
student330247324
- 63
- 3
-
Please share the work you've done so far on this problem. – John Jul 08 '14 at 13:48
-
1@john It is a plot that I drew myself (as you can see). There is not really any work that I can do. I read something about leverage and thought of this question. – student330247324 Jul 08 '14 at 13:52
-
Take a close look at the formulas: they should involve the mean value of the horizontal coordinates in the data. Therefore, for your question to be answerable, you need to indicate on the figure where that mean value is. – whuber Jul 08 '14 at 14:32
-
@whuber Sorry, I should probably have included axes in my figure. But what I meant is that the line that I drew spans the entire x-range of the data points. – student330247324 Jul 08 '14 at 15:06
-
4You seem to miss the point. There must be more x-values than the three you drew (the line you drew is not remotely near the least squares line for those three points), and so we need to know where the mean of all the x-values is, as whuber already said. Without that information, there's no way to say which has the higher leverage. – Glen_b Jul 08 '14 at 15:34
-
@Glen_b I think he means that the mean of x is in the middle of the x range of the line. – rbm Jul 08 '14 at 21:11
-
@glen_b @ rbm Yes, that's what I meant – student330247324 Jul 09 '14 at 08:24
-
Do you know the definition of leverage? – Glen_b Jul 09 '14 at 08:33
-
1@Glen_b Yes I do. The leverage is defined as $h_{ij}=\frac{1}{n}+\frac{(x_j-\bar{x})(x_i-\bar{x})}{\sum (x_i-\bar{x})^2}$ (can be derived from the hat matrix). – student330247324 Jul 09 '14 at 09:32
-
1The relevant definition in this problem is $h_{ii}$: http://en.wikipedia.org/wiki/Leverage_%28statistics%29#Definition . Note that all points will have the same denominator. Which point will have the largest numerator? – Glen_b Jul 09 '14 at 09:37
-
@Glen_b Ok, so that would then be $h_{ii}=\frac{1}{n} + \frac{(x_i-\bar{x})^2}{\sum (x_i-\bar{x})^2}$. But I don't yet find it easy to see from there what that would mean for this concrete example. – student330247324 Jul 09 '14 at 09:40
-
Can you see that if $(x_i-\bar{x})^2$ is greater, $h_{ii}$ is greater, as I suggested above? Please keep in mind the restrictions on answering [self-study](http://stats.stackexchange.com/tags/self-study/info) questions. – Glen_b Jul 09 '14 at 09:44
-
@Glen_b Ah oh wait, then it's actually easy. So the points with that are the farthest away from the mean of the x-coordinates of all the points have the highest leverage? So then here leverage 1 > leverage 3 > leverage 2? – student330247324 Jul 09 '14 at 09:47
-
1Yes, distance from the mean is the critical issue (for univariate $x$ at least). You may like to review whuber's initial comment, which was attempting to point you there without flat out stating it. I can't say for *certain* what the ordering is because your diagram still isn't sufficiently clear about the precise location of $\bar{x}$. – Glen_b Jul 09 '14 at 09:49
-
@glen_b Haha, sorry about it, should've seen it. Thanks though! – student330247324 Jul 09 '14 at 09:50
-
Did you want to write an answer? – Glen_b Jul 09 '14 at 10:01
-
@Glen_b What do you mean? I would accept yours if you would want to write your comments as an answer and else you can close/delete this question. Your comments made things clear :)! – student330247324 Jul 09 '14 at 10:10
-
I just wanted to give you the chance to do it, since you know it now. I'm content either way. – Glen_b Jul 09 '14 at 10:24
-
@Glen_b You're the one who answered it so I think it'd be most fair if you'd get the points. So if you want, you can go ahead and I'll accept it. – student330247324 Jul 09 '14 at 10:29
1 Answers
5
The leverage is $h_{ii}=\frac{1}{n}+\frac{(x_i-\bar{x})^2}{\sum (x_i-\bar{x})^2}\,$.
The term $\frac{1}{n}$ and the denominator of the second term $\sum (x_i-\bar{x})^2$ are the same for every $i$, so the point with the largest $(x_i-\bar{x})^2$ has the highest leverage.
This means that the point furthest from the mean has the highest leverage.
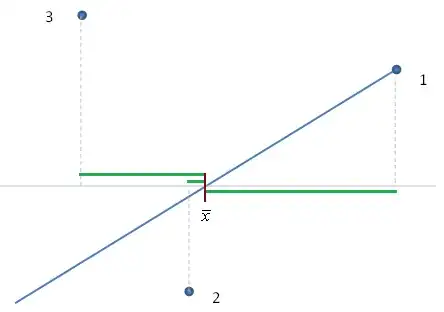
In the diagram, point 1 is the furthest from $\bar x$ in the x-direction, so it will have the largest leverage of the three points.
Glen_b
- 257,508
- 32
- 553
- 939
-
Thanks again. But isn't point 1 the farthest away from $\bar{x}$? – student330247324 Jul 09 '14 at 11:42
-
Correct. I was writing without being able to see the plot and misremembered which point carried which label. Fixed now, thanks. – Glen_b Jul 09 '14 at 12:09
-
1+1 I love illustrations, especially those that could stand on their own as solutions (even absent the words). But in this case wouldn't that suggest drawing *horizontal* dashed lines between the indicated points and the vertical line through $\bar{x}$? The vertical dashed lines appear to be relevant only by virtue of being directly proportional to those horizontal distances. – whuber Jul 09 '14 at 15:48
-
1@whuber The vertical dashed lines weren't themselves to indicate distance from the mean, but were intended to make the the abscissa for each point explicit, at which point the horizontal distance from $\bar x$ is easy to judge. But you're right that those distances should be explicitly marked. I'll do that now – Glen_b Jul 09 '14 at 22:34