8

Apologies from the go as this question comes from an absolute newbie and will definitely not satisfy a lot of the detail required. Hence, your guidance in providing you the right information to allow for the adequate answering of my question may be inevitable.

A brief summary of what's nagging at my mind currently. I have received a dataset from a colleague, which contains ~5000 patients and we're trying to determine how an initial treatment affects various outcome variables. Some of these are categorical (with 3 levels), some are continuous. The categorical variable is currently the least of my concerns, because as far as I can tell, I would have to perform multivariate regression, perhaps using MANOVA, to see how this dependent variable is affected by the other independent variables.

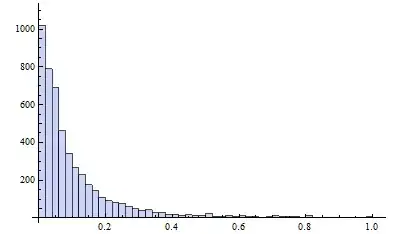
Now, what really bothers me is the distribution of the continuous data. This data consists of classic "count" data (number of times the doctor was visited following treatment) but then contains "time to heal". The "count" data would assume a Poisson distribution, but in this case var>mean ... so perhaps a quasi-Poisson would be more adequate. The distribution of that "count" data is depicted in figure 1. Figure 1

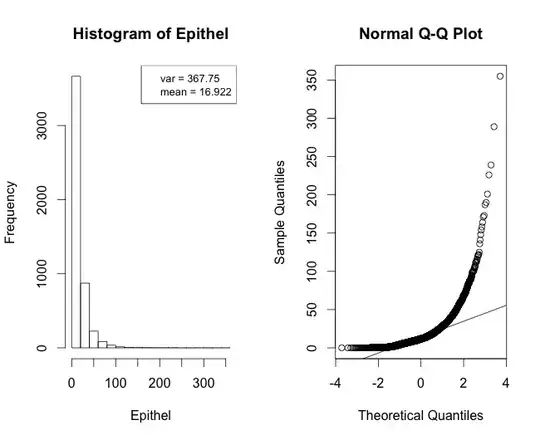
Now the time to heal is what's really bugging me. Some people would argue, that this would require linear regression modelling, but what I can't get my head around, is that time to heal, cannot be zero or take on negative numbers. And if one looks at the distribution of the data, it looks a lot more Poisson than anything else (Figure 2). So would this in fact require Poisson regression? Also biologically, time to heal is probably not completely linear, but more along what we see in cell culture growth, that it has a more exponential pattern, with a linear phase in it.

Figure 2

OR - and this brings me to the question in my title - because of the size of the dataset, which is fairly large, could one say that the central limit theorem holds true and I don't have to worry about the data-distribution? Clearly my plots tell me I do, no?!?

If I log-transform my data, things start to look quite ok (Figure 3)...but is a linear model adequate as the values cannot be negative or zero?

Figure 3

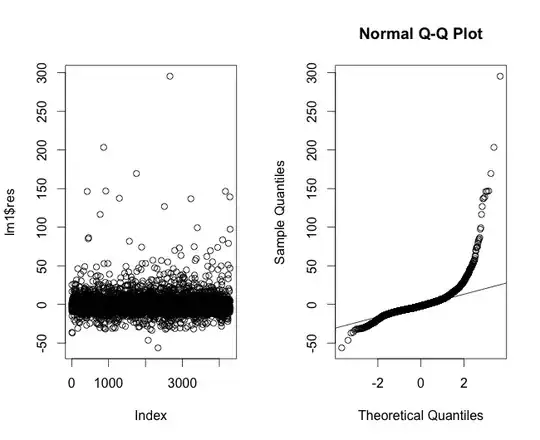
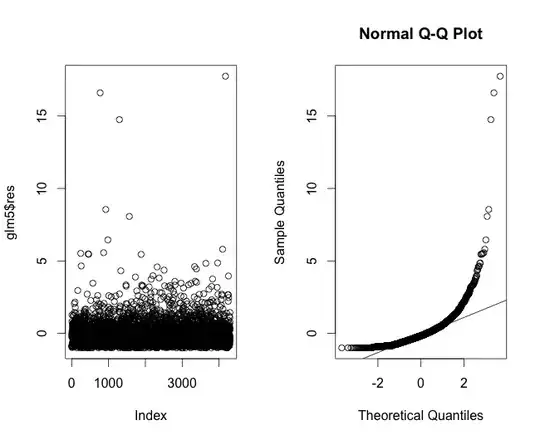
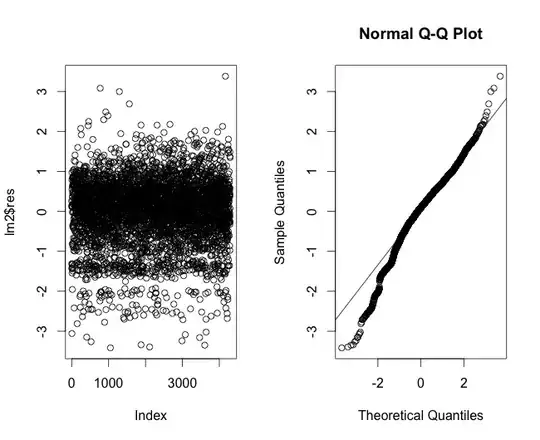
I've plotted the residuals of a linear regression model for the time to heal data in Figure 4, which shows that the tails don't really hold true to linearity. Then I plotted the residuals of the regression using a Poisson regression (Figure 5). Then the residuals of a linear regression model using log-transformation (Figure 6).

Figure 3 - Linear Model Figure 4 - Poisson model Figure 6 - Log transformed linear model

Just by looking at what you have here, what more information would you require? Am I going down a completely wrong path here? And if we assume an exponential curve for time to heal, what do I have to do to correct for this in my modelling process? And just because of the rule of numbers, could I spare myself all this thinking and simply assume that the CLT holds true?

I am very new to this, so any guidance would be more than welcome.

Hope not to have wasted anyone's time and apologize if I'm not posting crucial information here. Happy to learn, what more is required.

Scortchi - Reinstate Monica
  • 27,560
  • 8
  • 81
  • 248
OFish
  • 438
  • 1
  • 4
  • 13
  • 1
    Counts are *NOT* continuous; they're explicitly discrete - indeed, they're the non-negative integers 0,1,2,3, .... As an aside to your main question: -- since your data are counts, one might instead attempt to construct a suitable explicit multivariate model for count data. – Glen_b Jul 03 '14 at 02:32
  • Thanks @Glen_b, but measuring the time for something to heal, is that also count data seeing that there non-negative integers (however the integers are only because we cannot measure this more exactly in real life). And what model would you view as suitable? – OFish Jul 03 '14 at 02:43
  • Time to heal may be measured in integer days (or whatever), so it does seem like a count of days, but it's actually a duration, a continuous variable that's been rounded up/down/off in some way; that should be treated as a duration. Beware the impact censoring on durations, however. – Glen_b Jul 03 '14 at 03:42
  • That should say "...beware the impact censoring *has* on durations..." – Glen_b Jul 03 '14 at 04:33

6 Answers6

7

It is very unclear why you are dwelling on the CLT. What matters for your purpose is robustness and goodness of fit. For time-to-event data it is common to use a semiparametric survival model such as the Cox proportional odds model. You can also use the proportional odds ordinal logistic model, if there is no censoring. Such an ordinal model can handle the other outcome variables. Both proportional hazards and other ordinal models do not require you to select a transformation for $Y$, and they handle arbitrary clumping (e.g., at zero days).

Among other problems with "CLT thinking" is its false assumption that standard deviations are good measures of dispersion for asymmetrically distributed $Y$.

Frank Harrell
  • 74,029
  • 5
  • 148
  • 322
  • "Dwelling" may be the wrong term here, but due to the sample size of the cohort, I thought the principle that I don't have to worry about data distribution may hold true in this instance, which is essentially what the CLT says, no? – OFish Jul 04 '14 at 01:58
  • 1
    The CLT is about distribution of the mean, not distribution of the data itself. What the CLT says is that for examples like you have above, if you take the mean Epithel of many subsamples of your data, the distribution of the mean Epithel of the subsamples will be approximately normally distributed, the approximation getting better as the size of the subsample improves. You're very fundamentally misunderstanding the CLT. – Joe Jul 04 '14 at 12:19
  • Thanks for clarifying that Joe. Helps getting these answers here. – OFish Jul 10 '14 at 04:08
5

Not only do you have to worry about normality, you have to worry about equality of variance; with count data (and right skew continuous distributions for that matter), variance tends to be related to mean in some way. This variance issue won't be fixed by the central limit theorem.

I think you're correct in your thought that perhaps you should use something like Poisson regression for your count variable. There are some alternatives, but Poisson regression would be the first thing I'd consider. However, from the look of some of your plots, it's possible you'll need something heavier tailed, like a negative binomial.

I'd initially be considering some form of GLM for all your response variables. This will also make it easier to deal with the curvature (via use of appropriate link functions).

You mention censoring in your comment below; you're right not to ignore the censoring - Cox proportional hazards (which you mentioned) is a standard thing to try but there are other options available.

Scortchi - Reinstate Monica
  • 27,560
  • 8
  • 81
  • 248
Glen_b
  • 257,508
  • 32
  • 553
  • 939
  • Thanks glen, that's some great input and also confirms what I've been thinking. The count data is somewhat easier for me to deal with than the time to heal as I'm dealing with discrete variable that a) might have an underlying exponential curve, b) is similar to count data but as you said is a duration and c) has censoring affecting it. I've run some cox ph - (see other q on SV regarding that though), which gives some pretty interesting results. – OFish Jul 04 '14 at 01:44
  • 1
    It sounds like you have it pretty much in hand. I made a few additional comments but nothing that adds anything of much value to what you seem to be doing already. – Glen_b Jul 04 '14 at 03:45
  • thanks glen. Would be interested to hear your opinion on the q i posted regarding the cox model. will also be discussing all of these points with my (stats) supervisor. – OFish Jul 04 '14 at 04:54
3

OP, I may be misreading you: if I am, please let me know and I'll delete this answer.

It seems to me that you are fundamentally confused about what the CLT means. Nobody else has pointed this out, so perhaps I am wrong -- again, if so, please chime in.

Your post includes the following:

OR - and this brings me to the question in my title - because of the size of the dataset, which is fairly large, could one say that the central limit theorem holds true and I don't have to worry about the data-distribution? Clearly my plots tell me I do, no?!?

If I log-transform my data, things start to look quite ok (Figure 3)

What exactly do you mean when you say "the central limit theorem holds true"? If I am reading you correctly, you believe that, given a large enough sample size, all distributions become normal -- and that is false.

To give a concrete example: if $X_i$ are i.i.d. Uniform on $[0, 1]$, then $\frac{1}{n}\sum_{i=1}^nX_i$ will be asymptotically normally distributed as $n\rightarrow\infty$. But that does not mean that, given a large sample size, you should expect a histogram of the $X_i$s to look like a normal distribution.

Adrian
  • 3,754
  • 1
  • 18
  • 31
  • Adrian thanks for pointing that out and yes you did put your finger on it. I thought the CLT did in fact mean, that given a big enough sample size, normalization occurs and thus one does not need to "worry" about correction of the datasets for non-normality. But thank you for teaching me otherwise. Given your explanation however: If your plots tell you your data are non-normally distributed, you adapt the tests accordingly, right? Regardless if your sample sie were very large? Cheers. – OFish Jul 07 '14 at 05:01
  • 4
    The relevance of the CLT for regression is that the *coefficient estimates* tend towards having a normal distribution as sample size increases, even when the *errors* have a different distribution. – Scortchi - Reinstate Monica Jul 07 '14 at 09:14
0

The central limit theorem is an asymptotic result, which means that it has to hold as $n \rightarrow \infty$ (under certain regularity conditions), large enough is too vague a term.

In your case the distribution has a very heavy right tail (judging from the variance computed in figure 2). Thus, the occasional large value can make up a big chunk of the sum.

To make ideas clearer suppose 100 numbers sampled from the true distribution yielded 98 zeros and 2 numbers with value 300. Your estimate of the mean will be 6 which is far more affected by the occasional large numbers (300).

Sid
  • 2,489
  • 10
  • 15
  • I think what you're saying applies here. Especially the time to heal. The fact of the matter is, that the mean is being massively afffected by those patients who had long healing times. One can see this in the histogram. Perhaps I should just look at it as continous variable and log-transform it. Seems to do the job. @Glen_b: Because of the censoring effect (when someone's healed they drop out) I've been thinking of using a cox-proportional hazards model for the regression analysis. – OFish Jul 03 '14 at 05:30
-1

The distributions of $X$ and $Y$ are not important

The distribution of $X$ and $Y$ don't matter to linear regression. Recall the usual assumptions of the ordinary least squares. Nowhere it says anything about the shape of the dependent and independent variable.

To believe it, run this regression in R:

x<-rexp(1000)
y<-5*x+rnorm(1000)
summary(lm(y~x))

Both $X$ and $Y$ are exponentially distributed, regression still finds the right parameter.

The normality of the errors is overrated

You showed us that the residuals are not normal. Okay, what does that actually tell you? Very little. It doesn't mean the estimates are wrong, try this in R:

x<-rexp(1000)
y<-5*x+rexp(1000)
summary(lm(y~x))

And see, even with exponential errors, the regression is still on the mark.

The fact is: normality of the errors only matters to the estimation of confidence intervals and p values. What if you really need confidence intervals or p-values and the residuals aren't normal? Use bootstrap.
A real problem is outliers (see those residuals at 15 in your plot?), those do bias results and you might have to remove them, or use some robust regression or both.

Your real problem is model selection

What I see is that you have many models you can feed this data to. You are asking us to pick one. We can't answer that for you. You have to do this on your own. Luckily it's pretty easy to do. Run all the models you can think of. All the regressions, with all the transformations of the data and all the permutations of regressors. Then choose the one that predicts better.

Learn cross-validation. Which is easy and does precisely that. Choose the model with the lowest cross-validated error

CarrKnight
  • 1,218
  • 9
  • 18
  • 2
    Normality of errors is exceedingly important if you want to estimate the median, other quantiles, or the probability that $Y > y$. – Frank Harrell Jul 03 '14 at 12:01
  • No. Normality is important to estimate CI (and medians and quantiles and all that) in the usual way. Bootstrap estimates all quantiles and medians WITHOUT the assumption of normality. – CarrKnight Jul 03 '14 at 13:06
  • 2
    That is not correct. If you assume a Gaussian model when it is false, your estimates of quantiles and probabilities will be incorrect; only the mean will be correct. The estimate of the mean may be very inefficient. The CLT has nothing to do with accuracy/model fit. – Frank Harrell Jul 03 '14 at 13:48
  • I am afraid we are talking past one another. Bootstrap doesn't assume the gaussian model. That's the point of bootstrap, really. – CarrKnight Jul 03 '14 at 13:59
  • 1
    No, it's not. The bootstrap can get somewhat accurate confidence intervals for the wrong quantity, without assuming normality. Take the log-Gaussian one-sample problem. The MLE of the scale parameter uses the sum of squared differences on the log-transformed scale. The MLE of the mean is the anti-log of the MLE of the location parameter, multiplied by an anti-log of a constant times the MLE of the scale parameter. Analyzing the data on the original scale will be very inefficient. And in your previous comment you confused quantiles of _statistics_ with quantiles of $Y | X$. – Frank Harrell Jul 03 '14 at 14:06
  • No. While bootstrap is usually used for quantiles of statistics, quantiles of $Y|X$ are just as doable. See section 6.3.3 of Bootstrap methods and their applications (page 284). As to the log-gaussian problem, I admit I haven't understood your point. Maybe there is a terminology barrier. Would you explain it again with mathematical formulas? – CarrKnight Jul 03 '14 at 14:36
  • Let us [continue this discussion in chat](http://chat.stackexchange.com/rooms/15516/discussion-between-carrknight-and-frank-harrell). – CarrKnight Jul 03 '14 at 14:42
  • 1
    The fact that something may come from a log-Gaussian distribution implies that treating it as coming from a Gaussian distribution (or residuals are Gaussian) leads to many problems that the bootstrap doesn't know enough to fix. You can derive bootstrap estimators of quantiles (e.g., the Harrell-Davis estimator) but the vast majority of bootstrap users use the bootstrap to study the performance of an established estimator. – Frank Harrell Jul 03 '14 at 14:49
  • 1
    The final recommendations sound like a prescription for over-fitting. What would prevent that from happening? – whuber Jul 03 '14 at 15:30
  • Please elaborate on over-fitting. – Frank Harrell Jul 03 '14 at 15:32
  • Sure! To simplify, imagine we only one X (number of visits). Run a few different regressions $Y=X$ --- $Y=\log(X)$ --- $\log(Y)=X$ --- $\log(Y)=\log(X)$, and so on. Then by cross-validation check which one has the lowest predictive error. If anything it avoids overfitting! – CarrKnight Jul 03 '14 at 15:40
  • 3
    Cross-validation will tell you that you paid a price for model uncertainty. IMHO it is better to use a semiparametric model to completely avoid the $Y$-transform issue, and use a regression spline for $X$ and pay for $X$-transformation uncertainty according to the degrees of freedom in the spline function. – Frank Harrell Jul 03 '14 at 17:27
  • That's a great idea. That's what I would do too. But I would have to know which spline basis to use. And again, cross-validation would tell me that. – CarrKnight Jul 03 '14 at 17:45
  • 1
    What I prefer is to use an easy to handle spline basis (truncated power basis), assign knots where data are dense in the univariate sense, choose the number of parameters that I wish to devote to $X$, and then fit the spline function without using C-V or bootstrap for any selection. That's the way my R `rms` package works. – Frank Harrell Jul 03 '14 at 20:12
  • 1
    Thanks guys, very interesting and it tells me that there are various ways to deal with this. I wasn't looking for someone to tell me "choose this model", but what I exactly wanted are the opinions stated here: neg-binomial regression, bootstrapping for the 95%CIs and p-values I'll definitely require or use cross-validation etc. These are all things that I will discuss with my stats supervisor. But what it does tell me is that a simple linear regression model lm will not account for all of the issues with the data, although you do kind of say it would @CarrKnight. – OFish Jul 04 '14 at 01:51
  • Good luck with your work! – CarrKnight Jul 04 '14 at 02:09
  • 1
    It's important to recall that cross-validating a model-fitting method doesn't *tell* you its predictive performance, but *estimates* it. So when you fit "all the models you can think of", the estimate of the best's predictive performance is optimistic, & the estimate of the worst's is pessimistic, for just the same reasons as given [here](http://stats.stackexchange.com/questions/20836/20856#20856). If you want a good estimate of how the whole procedure - selection & fitting - performs, you need to use [nested cross-validation](http://stats.stackexchange.com/questions/5918/5988#5988). – Scortchi - Reinstate Monica Jul 04 '14 at 08:39
  • What would be the inner loop of a nested cross validation when we are only using *linear regressions*? Betas aren't set by CV, so what's the benefit? – CarrKnight Jul 04 '14 at 12:59
  • The inner loops would be to evaluate whatever you meant by the "cross-validated error" for each model - say the residual sum of squares averaged over five test folds. Then the outer loop would be to give an honest estimate of how a model selected for having the lowest cross-validated error will perform. – Scortchi - Reinstate Monica Jul 04 '14 at 13:48
  • Sure, but you can see that the model selection happens only in the inner loop. This is because, unlike Varma and Simon nested-CV paper, we are dealing with no hyper-parameters (which is really where you need nested-CV anyway). Sure you can build a whole other loop just to estimate properly the prediction error, but by then the model has already been selected here. You are 100% correct, but i am not sure how useful this exchange was. Now if the question had been "SVM or Random Forests?"... – CarrKnight Jul 04 '14 at 15:10
  • 1
    Yes - estimating the prediction error properly is the whole point, & essential before daring to use a model selected from among "all the models you can think of", with "all the transformations of the data and all the permutations of regressors". The more fertile your imagination & the more permutations there are to examine, the more prone such an approach will be to over-fitting. – Scortchi - Reinstate Monica Jul 04 '14 at 16:24
  • I am terribly sorry to say, but I think you are contradicting yourself. If you set up, as you do, a nested CV where the model selection happens only in the inner loop, then you are ipso-facto selecting the model through normal CV. If, as you claim, there is a risk of overfitting for CV then that risk is just as present in your nested CV. Again, I suggest you read the original paper by Varma and Simon. It's open access! http://www.biomedcentral.com/1471-2105/7/91. Let me quote: *[CV] for a classifier **that has itself been tuned using CV** gives a significantly biased estimate* – CarrKnight Jul 04 '14 at 18:07
  • I'm rather at a loss to respond, as if for "a classifier that has itself been tuned using CV" you understand "selecting a model by CV" then V.&S. are making exactly the same point I am. They continue:-"Proper use of CV for estimating true error of a classifier developed using a well defined algorithm requires that all steps of the algorithm, including classifier parameter tuning, be repeated in each CV loop. A nested CV procedure provides an almost unbiased estimate of the true error." – Scortchi - Reinstate Monica Jul 04 '14 at 19:59
  • Sigh. I guess we went full circle then. I said use CV for model selection, you say yeah but you need nested cv for real predictive error, I say that real predictive error is useless for model selection in this case since you are not comparing different optimal hyper-parameters and you say yeah but you need nested cv for true predictive error. You are, as I said before, 100% correct. I still fail to see any contribution or any allegged overfitting correction. – CarrKnight Jul 04 '14 at 20:21
  • 1
    Sorry for that rather laboured exchange; but why then, being aware of the issue, are you advocating an approach that tries out an unlimited number of models (without applying any shrinkage to coefficient estimates), picking one with the best value of some statistic, & claiming that it avoids over-fitting? It's not true: the more models you try, the bigger the difference between the best's apparent predictive performance & the true predictive performance, i.e. the more it over-fits. That the statistic in question is an estimate of prediction error got by cross-validation really doesn't alter – Scortchi - Reinstate Monica Jul 05 '14 at 10:50
  • this. See the discussion (& references) [here](http://stats.stackexchange.com/questions/29354/29377#29377) for a machine-learning perspective. Also the precis [here](http://stats.stackexchange.com/questions/32415/32446#32446):-"Optimisation is the root of all over-fitting, so the best way to avoid over-fitting is to minimise the amount of optimisation you do". – Scortchi - Reinstate Monica Jul 05 '14 at 11:08
  • hey, many thanks for the reference. Listen, this comment section is basically exploding, can we continue this in chat? – CarrKnight Jul 05 '14 at 11:57
  • 1
    thanks guys. an interesting read. btw @CarrKnight: The link you posted for bootstrapping doesn't work....was wondering if you could resend it? Cheers, O. – OFish Jul 07 '14 at 05:08
  • Sure thing man. I changed the link. It should now point to the 2012 lecture notes on bootstrap. – CarrKnight Jul 07 '14 at 11:28
-1

Некоторые вдохновения: 1) Если мы не так много нулей, ZIP & ZINB может быть рациональный выбор; 2) мне кажется, приятно и проще inpretability будет для барьер модель: logit для reg шансов - "0 или >0" и какой-то граф-регрессии для >0 (Пуассона, Q-Poiss., negBin., гамма, logNorm и др.). Опять же, последняя похожа на " выбор модели' проблема (choosinng виде stohastic спецификации части). http://cran.r-project.org/web/packages/pscl/vignettes/countreg.pdf Удачи!