40

Comments: Firstly I would like to say a big thank you to the author of the new tsoutliers package which implements Chen and Liu's time series outlier detection which was published in the Journal of the American Statistical Association in 1993 in Open Source software $R$.

The package detects 5 different types of outliers iteratively in time series data:

  1. Additive Outlier (AO)
  2. Innovation Outlier (IO)
  3. Level Shift (LS)
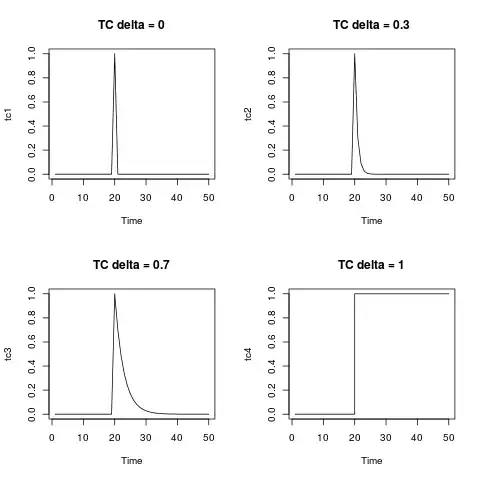
  4. Temporary change (TC)
  5. Seasonal Level Shift (SLS)

What is even more great is that this package implements auto.arima from forecast package so detecting outliers is seamless. Also the package produces nice plots for better understanding of the time series data.

Below are my questions:

I tried running few examples using this package and it worked great. Additive outliers and level shift are intuitive. However, I had 2 questions with regards to handing Temporary Change outlier and Innovational outliers which I'm unable to understand.

Temporary Change Outlier Example:

Consider the following example:

library(tsoutliers)
library(expsmooth)
library(fma)

outlier.chicken <- tsoutliers::tso(chicken,types = c("AO","LS","TC"),maxit.iloop=10)
outlier.chicken
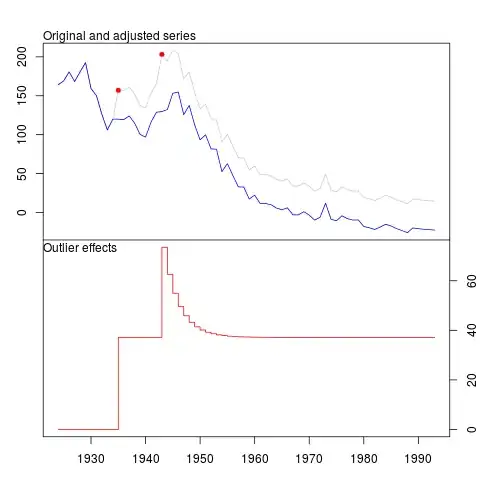
plot(outlier.chicken)

The program rightly detects a level shift and a temporary change at the following location.

Outliers:
  type ind time coefhat tstat
1   LS  12 1935   37.14 3.153
2   TC  20 1943   36.38 3.350

Below is the plot and my questions.

  • How to write the temporary change in an equation format ? (Level shift can be easily written as a binary variable, anytime before 1935/Obs 12 is 0 and any time after 1935 and after is 1.)

The equation for temporary change in the package manual and the article is given as :

$$ L(B) = \frac{1} {1-\delta B} $$

where $\delta$ is 0.7. I'm just strugling to translate this to the example above.

  • My second question is about innovational outlier, I have never come
    across an innovational outlier in practice. any numercial example or a case example would be very helpful.

outliers

Edit: @Irishstat, the tsoutliers function does an excellent job in identifying outliers and suggesting an appropriate ARIMA model. Looking at the Nile dataset, see below application of auto.arima and then applying tsoutliers (with defaults which includes auto.arima):

auto.arima(Nile)
Series: Nile 
ARIMA(1,1,1)                    

Coefficients:
         ar1      ma1
      0.2544  -0.8741
s.e.  0.1194   0.0605

sigma^2 estimated as 19769:  log likelihood=-630.63
AIC=1267.25   AICc=1267.51   BIC=1275.04

After applying tsoutliers function, it identifies an LS outlier and additive outlier and recommends an ARIMA order (0,0,0).

nile.outliers <- tso(Nile,types = c("AO","LS","TC"))
nile.outliers
Series: Nile 
ARIMA(0,0,0) with non-zero mean 

Coefficients:
      intercept       LS29       AO43
      1097.7500  -242.2289  -399.5211
s.e.    22.6783    26.7793   120.8446

sigma^2 estimated as 14401:  log likelihood=-620.65
AIC=1249.29   AICc=1249.71   BIC=1259.71

Outliers:
  type ind time coefhat  tstat
1   LS  29 1899  -242.2 -9.045
2   AO  43 1913  -399.5 -3.306

enter image description here

forecaster
  • 7,349
  • 9
  • 43
  • 81
  • 8
    I am glad to see that you found the package useful, thanks! BTW I have fixed a typo in the function that plots the results so that in the next release of the package the y-axis will cover the range of both the original and the adjusted series. – javlacalle Jun 26 '14 at 22:55
  • 2
    In the last version of the package, the function `tsoutliers` has been renamed as `tso` to avoid conflict with a function of the same name in package `forecast`. – javlacalle Jun 28 '14 at 08:51
  • 1
    @javlacalle I downloaded the latest tsoutliers package it still has tsoutliers not tso. I'm not sure when the package will be updated. I'm glad that we have different funtion names. – forecaster Jun 30 '14 at 13:55
  • I rushed a little bit informing about the update. It takes some time until it is updated on CRAN. I've just seen that the latest version 0.4 can be downloaded from CRAN. – javlacalle Jun 30 '14 at 17:34
  • @javlacalle I found tsoutliers really difficult to install on my mac. I brew installed gsl, I tried to compile using `clang` and `gcc` and [neither](http://stackoverflow.com/questions/27065600/r-install-kfksds-on-mac) works. I think it is an awesome package but the installation really broke my heart. – B.Mr.W. Nov 24 '14 at 21:47
  • @B.Mr.W. thanks for your interest in the package and reporting this issue. Installation from source of the required package [KFKSDS](http://cran.r-project.org/package=KFKSDS) requires having installed the development version of [GSL](http://www.gnu.org/software/gsl/). I cannot check the installation process on a mac but will see if I should add something in the sources of `KFKSDS` to make the installation easier. – javlacalle Nov 25 '14 at 18:14
  • @B.Mr.W. I would recommend you trying the ideas in [this post](http://stackoverflow.com/questions/24781125). You could also try editing the file KFKSDS/src/Makevars with the contents of Makevars.in available in the same directory of package [gsl](http://cran.r-project.org/package=gsl). – javlacalle Nov 25 '14 at 18:16
  • @javlacalle I have no problem installing either gsl pkg or gsl itself. And I change the Makevars and they still not work. I guess I will just use RStudio server on our server for now... and quietly wait for some magic from you. I will it could be in CRAN since it is such an awesome library. :) – B.Mr.W. Nov 25 '14 at 21:58
  • @B.Mr.W. Thanks for trying this. I will inspect the sources of package gsl and see how they deal with the installation on a mac. – javlacalle Nov 26 '14 at 11:36
  • I had trouble installing the KFKSDS in Ubuntu 16.04. I finally solved it installing `libgsl-dev` in system with `apt-get`. – Diego-MX Dec 14 '16 at 16:56
  • Chicken. The 1973 outlier is missed. The true model is a random walk. The flagging of a level shift at 1935 is a false positive. It gets 1 of 3 right and misses an outlier. Nile. The true model is no model. 1877 and 1864 are missed, but the level shift 1899 and outlier at 1913 are found. It gets 2 out of 2 right, but misses two outliers. – Tom Reilly Jul 19 '17 at 13:59
  • edit 1864=1964. – Tom Reilly Jul 19 '17 at 14:47
  • @tomreilly the model correctly flags the level shift at 1899 not 1935 and also identifies the true no arima (random walk/white noise). There is no false positive in the above model, your comment is misleading and confusing. – forecaster Jul 19 '17 at 16:06
  • @forecaster, the "1935" comment is related to the chicken example and NOT the nile example. – Tom Reilly Jul 19 '17 at 16:14

1 Answers1

22

The temporary change, TC, is a general type of outlier. The equation given in the documentation of the package and that you wrote is the equation that describes the dynamics of this type of outlier. You can generate it by means of the function filter as shown below. It is illuminating to display it for several values of delta. For $\delta=0$ the TC collapses in an additive outlier; on the other extreme, $\delta=1$, the TC is like a level shift.

tc <- rep(0, 50)
tc[20] <- 1
tc1 <- filter(tc, filter = 0, method = "recursive")
tc2 <- filter(tc, filter = 0.3, method = "recursive")
tc3 <- filter(tc, filter = 0.7, method = "recursive")
tc4 <- filter(tc, filter = 1, method = "recursive")
par(mfrow = c(2,2))
plot(tc1, main = "TC delta = 0")
plot(tc2, main = "TC delta = 0.3")
plot(tc3, main = "TC delta = 0.7")
plot(tc4, main = "TC delta = 1", type = "s")

tremporary change

In your example, you can use the function outliers.effects to represent the effects of the detected outliers on the observed series:

# unit impulse
m1 <- ts(outliers.effects(outlier.chicken$outliers, n = length(chicken), weights = FALSE))
tsp(m1) <- tsp(chicken)
# weighted by the estimated coefficients
m2 <- ts(outliers.effects(outlier.chicken$outliers, n = length(chicken), weights = TRUE))
tsp(m2) <- tsp(chicken)

The innovational outlier, IO, is more peculiar. Contrary to the other types of outliers considered in tsoutliers, the effect of the IO depends on the selected model and on the parameter estimates. This fact can be troublesome in series with many outliers. In the first iterations of the algorithm (where the effect of some of the outliers may not have been detected and adjusted) the quality of the estimates of the ARIMA model may not be good enough as to accurately define the IO. Moreover, as the algorithm makes progress a new ARIMA model may be selected. Thus, it is possible to detect an IO at a preliminary stage with an ARIMA model but eventually its dynamic is defined by another ARIMA model chosen in the last stage.

In this document (1) it is shown that, in some circumstances, the influence of an IO may increase as the date of its occurrence becomes more distant into the past, which is something hard to interpret or assume.

The IO has an interesting potential since it may capture seasonal outliers. The other types of outliers considered in tsoutlierscannot capture seasonal patterns. Nevertheless, in some cases it may be better to search for a possible seasonal level shifts, SLS, instead of IO (as shown in the document mentioned before).

The IO has an appealing interpretation. It is sometimes understood as an additive outlier that affects the disturbance term and then propagates in the series according to the dynamic of the ARIMA model. In this sense, the IO is like an additive outlier, both of them affect a single observation but the IO is an impulse in the disturbance term while the AO is an impulse added directly to the values generated by the ARIMA model or the data generating process. Whether outliers affect the innovations or are outside the disturbance term may be a matter of discussion.

In the previous reference you may find some examples of real data where IO are detected.


(1) Seasonal outliers in time series. Regina Kaiser and Agustín Maravall. Document 20.II.2001.

javlacalle
  • 11,184
  • 27
  • 53
  • Thanks for detailed response. i really appreciate it. I have few additional questions. Are there any advantages in using auto.arima, identify the p,d,q and then using tsoutliers using arima as the tsmethod? – forecaster Jun 26 '14 at 23:10
  • also sometimes when I use IO, I get the follwoing warning message; stopped when ‘maxit’ was reached, also I sometime get the folloing warning: In locate.outliers.oloop(y = y, fit = fit, types = types, cval = cval, : stopped when ‘maxit’ was reached. Is there a way to avoid the – forecaster Jun 26 '14 at 23:18
  • 1
    The main advantage of using `forecast::auto.arima` along with `tsoutliers` is that everything gets automated. However, it is advisable to run the automatic procedures with alternative options. You may first for example look at the ACF or unit root tests and then choose an ARIMA model to be passed to `tsoutliers`. If any outliers are found for your proposed model then you can repeat again the analysis for the adjusted series. It is an iterative process. The automatic procedure provides a helpful guide but it may not necessarily give the ultimate or unique solution. – javlacalle Jun 26 '14 at 23:54
  • 1
    The procedure to locate outliers is iterative. For safety a limit is set on the number of allowable iterations. When you observe the warning you may try running the algorithm increasing the argument `maxit.iloop` to 5-6 and see if the results change. If the warning is returned with a large `maxit.iloop` (e.g. 20 or more) it may be a sign that something is not being modelled properly. Removing IO from the types of outliers to be considered may be a good option in some cases. In most cases you can ignore the warning. You can use `suppressWarnings` to avoid them. – javlacalle Jun 27 '14 at 00:08
  • @javlacelle You assume no outliers(pulses/Lshifts/seasonal level shifts AND no time trends)are present & the parameters of a model are constant over time.You use the AIC/BIC criterion to identify an ARIMA. You identify outliers(no time trends) which had been assumed to be non-existent.This sequence of unverified assumtions leading to a potentially misspecified ARIMA model might have consequences.How does this procedure would work with the Nile Data which correctly requires no differencing http://support.sas.com/documentation/cdl/en/etsug/63348/HTML/default/viewer.htm#etsug_arima_sect060.htm – IrishStat Jun 28 '14 at 15:57
  • @IrishStat Using the default options with the Nile time series, a level shift is detected at observation 29 and an additive outliers at observation 43. No ARIMA structure is identified, an ARIMA(0,0,0) with intercept is chosen. If the ARIMA(0,0,1) is specified (as suggested in the link that you gave) no outliers are detected. – javlacalle Jun 28 '14 at 19:52
  • The model (incorrect !) suggested in the reference was ARIMA(0,1,1) not ARIMA(0,0,1) – IrishStat Jun 28 '14 at 21:12
  • @IrishStat maybe I missed something but they say "the following stationary MA1 model (with regressors) appears to fit the data well". Anyway, I agree with you that the Nile data requires no differencing. – javlacalle Jun 28 '14 at 22:19
  • from the web http://support.sas.com/documentation/cdl/en/etsug/63348/HTML/default/viewer.htm#etsug_arima_sect060.htm The following program fits an ARIMA model, ARIMA(0,1,1), similar to the structural model suggested in de Jong and Penzer (1998). This model is also suggested by the usual correlation analysis of the series.By default,the OUTLIER statementrequests detection of additive outliers and level shifts,assuming that the series follows the estimated model. /*-- ARIMA(0, 1, 1) Model --*/ – IrishStat Jun 28 '14 at 23:45
  • @javlacalle Is there a way to replace the outlier with an interpolated value like the forecast::tsclean function ? Thanks. – Anusha Sep 12 '14 at 08:15
  • @Anusha The function `tso` returns a series cleaned from the effects of the detected outliers. It is returned in an element called `yadj` (adjusted series), see the blue line in the first plot above. If you prefer to replace the detected outliers by interpolated values you can set those observations to `NA`s and apply the Kalman smoother as shown in [this post](http://stats.stackexchange.com/questions/104565/how-to-use-auto-arima-to-impute-missing-values). – javlacalle Sep 13 '14 at 09:51
  • @javlacalle Thank you for the reply. What method is used for calculating these adjusted values. Sorry if I missed it in the package manual. It may help users to decide which method to use. If I may say so, isnt there a lot of change between actual and adjusted series ? Because of two outliers, the entire series is shifted down. Isnt only that point to be adjusted ? Is that correct way or am I missing something basic ? Thanks. – Anusha Sep 13 '14 at 18:12
  • @Anusha The effect of the outliers is estimated in a model (e.g. ARIMA model) where the outliers are included as regressors. The regressors are weighted by the estimated coefficients and then removed from the original series, `yadj = y - xreg %*% xregcoefs`. In the example you see a clear change in the adjusted series because one of the outliers is a level shift. The package contains a document that complements the help files describing the types of outliers that are considered and the procedure to detect them. This document can be obtained through the help page of the package. – javlacalle Sep 13 '14 at 21:09
  • @javlacalle would you mind suggesting a book covering outliers for time series? (maybe a general time series book) – mugen Jan 19 '15 at 23:34
  • 2
    @mugen I don't know a textbook covering this issue thoroughly. As the approach discussed in this post is related to intervention analysis, any textbook (on Econometrics or Time Series) with a chapter about this issue would be helpful; for example, [Time Series Analysis. With Applications in R](http://www.springer.com/mathematics/probability/book/978-0-387-75958-6). For details, you should review some of the many journal articles dealing with this issue, starting for example by [Chen and Liu (1993)](http://doi.org/10.1080/01621459.1993.10594321) and the references therein. – javlacalle Jan 20 '15 at 13:29
  • 2
    @mugen, I would also check out [Tsay's](http://www.unc.edu/~jbhill/tsay.pdf) article. In addition, I would check classic book by [Pankratz](http://www.amazon.com/Forecasting-Dynamic-Regression-Models-Pankratz/dp/0471615285/ref=sr_1_1?ie=UTF8&qid=1422059381&sr=8-1&keywords=Alan+pankratz) which has good coverage on outliers. – forecaster Jan 24 '15 at 00:31
  • Is there an equivalent package similar to `tsoutliers` in Python – kanna Sep 30 '18 at 04:42
  • @kanna There will probably be something similar. You should search on the internet or make a question at a more appropriate forum for this kind of question, for example one of those mentioned [here](https://stats.meta.stackexchange.com/questions/793/internet-support-for-statistics-software). – javlacalle Oct 01 '18 at 08:48
  • The link in this answer "this document" is broken, where can I find this reference? – Frank Mar 05 '20 at 20:44
  • 1
    @Frank I have fixed the link and added the reference. – javlacalle Mar 10 '20 at 21:53