19

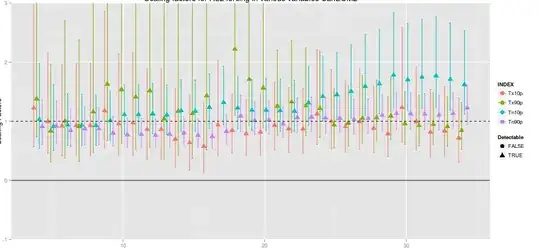
I am using ggplot2 in R to make plots like the following ones:

enter image description here

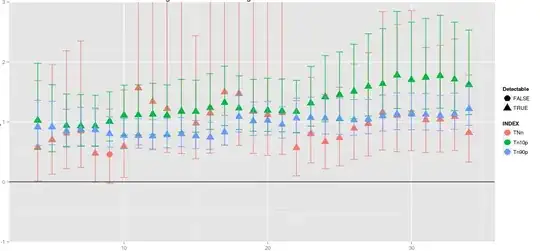
The errorbars overlap with each other which look really messy. How can I separate the errorbars for different indices? I have used position="dodge" but it seems to be not working. Here is the main part of my code:

plot =  ggplot(data,aes(x=ntrunc,y=beta_best,group=ntrunc,colour=INDEX))
       +geom_point(aes(shape=detectable),na.rm=TRUE,position="dodge") 
        +geom_errorbar(aes(x=ntrunc,ymax=beta_high,ymin=beta_low),na.rm=TRUE,position="dodge")
ycc
  • 411
  • 1
  • 3
  • 6
  • 1
    Have you tried different values of "dodge"? For example something like that: `position = position_dodge(width = 0.90)`. See also [this post](http://stackoverflow.com/a/5256758/2378656). – COOLSerdash Jun 14 '14 at 15:21
  • Thanks for your example. However, I have just tried different values of width and it still does't work. – ycc Jun 14 '14 at 15:40
  • 2
    It is difficult to come up with solutions without the original dataset. But one question I have: Why are your $x$-values and the "groups" the same? What is `ntrunc`? Shouldn't `group` be `INDEX`? – COOLSerdash Jun 14 '14 at 16:27
  • It works now after I changed group="INDEX". I think I have misunderstood the meaning of 'group'. Thanks @COOLSerdash – ycc Jun 15 '14 at 01:01

1 Answers1

12

The group should = INDEX instead of ntrunc in the aes.

plot =  ggplot(data, aes(x=ntrunc, y=beta_best, group=INDEX, colour=INDEX)) +
   geom_point(aes(shape=detectable), na.rm=TRUE, position="dodge") +
   geom_errorbar(aes(x=ntrunc, ymax=beta_high, ymin=beta_low), na.rm=TRUE, position="dodge")

The plot looks better now.

enter image description here

ycc
  • 411
  • 1
  • 3
  • 6