3

I have a dataset where I extract the mean and the standard deviation, I want to generate a new synthetic dataset which is lognormal distributed based on the original dataset paramaters. Like a montecarlo simulation.

My problem is that I need that synthetic dataset is truncated, with the maximum and minimum value of the orignal set, in other words I don't want any synthetic value greater than the maximum value and minimum value of the original datset.

Thanks @whuber, following your guidelines it works perfectly with the positive side of my original dataset, long right tail distribution within the max and min limits.

enter image description here

Vince
  • 131
  • 1
  • 1
  • 3
  • How do you want to handle data outside min and max? Are you satisfied with capping, meaning there will be mass points atthe min and max, or do you want a lognormal conditional on being within the min and max? The former is easily handled by min/max or median calls in Excel. The latter is harder. – Avraham Jun 15 '14 at 20:59
  • Hi @Avraham. I don't want any value outside the max and min in the synthetic dataseries generated. I would like to get n random lognormal synthetic dataseries from the original, but i don't want any value outside min and max of the original. – Vince Jun 17 '14 at 11:33
  • Yes, but there are two ways to handle it. One is to deal with a regular distribution which has probability outside the limits, but cap the observations. So if you would generate a 6.4, it would be forced to be a 5.59 and similarly for the min. Which means that less than 100% exists between max and min, and there are mass points at the end. The other way is to create a conditional distribution that only exists between max and min, and 100% lives between max and min, and P(x < min) = P (> max) = 0. – Avraham Jun 17 '14 at 14:17
  • Look at the excellent answer of @whuber. – Avraham Jun 17 '14 at 18:33
  • Yes @Avraham, awasome answer. I edited after read his great answer, but hard to me to understand it, i'll do my best with your help and my new detail. – Vince Jun 17 '14 at 18:36
  • Peering closely at the graphic in your post, I see some negative values in your "original data." The lognormal is defined on the non-negative numbers; are you certain you want to fit a lognormal? – Avraham Jun 17 '14 at 19:00
  • Yes, @Avraham, i know a lognormal don't have negative numbers, sometimes my original data have very long tails to the positive side. i deal always with two sort of original data, pseudonomal and anothers with long positive tails. I realized that with one of your solutions it's very easy to do what i want, i am editing my post again modifying the formula with your solution but i don't know if it will be accurate enough. – Vince Jun 17 '14 at 19:07
  • I will not question your objectives, which are obscure, but will merely remark that your step (4) does not generate truncated lognormal variates: it appears to generate a *mixture* of something complicated (which I don't care to analyze further; it's enough to know that it is incorrect). Since you wish to understand how to generate truncated lognormals step by step, I will humbly refer you back to my answer which describes this process in three ways, including step-by-step Excel formulas that you can follow. – whuber Jun 17 '14 at 19:24
  • Thank you @whuber, i'll try to work and understand your answer deeply. I have a little mess, and my approach as you said is not correct. – Vince Jun 17 '14 at 19:30

1 Answers1

4

Solution

Generate these numbers using the probability integral transform.

When $F$ is any cumulative distribution function and it is truncated at values $t_0 \lt t_1$, then random values can be obtained as

$$X = F^{-1}(U)$$

where $U$ is uniformly distributed in the interval $[a,b]=[F(t_0), F(t_1)]$. In this case $F^{-1}$ can be computed explicitly (even by Excel).


Implementation Details

Due to the notorious and long-standing deficiencies in Excel's documentation and computations, I never use its lognormal functions: as a policy, I use only the most basic function that will get the job done. This minimizes the amount of testing that needs to be performed in order to establish reliable results and maximizes the chance that I correctly understand what the software is doing.

In this case, everything can be handled with the CDF $\Phi$ and inverse CDF $\Phi^{-1}$ of the standard normal distribution. (Excel's names for these are NORMSDIST and NORMSINV, respectively.) For a lognormal distribution of mean $m$ and standard deviation $s$, compute

$$\sigma = \log\left(1 + \left(\frac{s}{m}\right)^2\right)$$

and then

$$\mu = \log(m) - \sigma^2/2.$$

These are the standard deviation and mean, respectively, of the distribution of the logarithms of the values. In these terms

$$F(x) = \Phi\left(\frac{\log(x) - \mu}{\sigma}\right)$$

and

$$F^{-1}(q) = \exp\left(\mu + \sigma \Phi^{-1}(q)\right).$$

In Excel--as well as in many other software platforms--a uniform random value $U$ in an interval $[a,b]$ is generated by obtaining a random variate $V$ from the interval $[0,1]$--which is produced by Excel's RAND function--and rescaling it:

$$U = a + (b-a)V.$$


Excel Implementation

In addition to the usual arithmetic operations (addition, multiplication, etc) this calculation relies on only four functions: RAND, NORMSDIST, NORMSINV, and LN. The first three have well-known problems (but there's no workaround for them short of recoding them in VBA). Nevertheless, for the small simulations that Excel can handle RAND will be fine--especially when using more recent versions of Excel--and the errors in NORMSDIST and NORMSINV (which occur way out in the tails) are unlikely to be encountered.

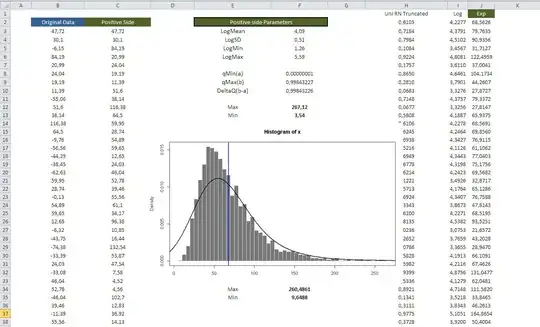
The screen shot displays a portion of spreadsheet in which 256 random variates X (in column C) are generated according to the specifications at its right: Mean, SD, Min, and Max. These are the only inputs to the calculation. The bars in the chart tally one realization of these variates while the solid line is the graph of the truncated probability density function (rescaled to show the expected counts in each bin). The deviations between the bar heights and the graph are due to random variation only. (Notice how level the graph is: in this particular example the truncated lognormal distribution could be closely approximated by a simple uniform distribution.)

Figure

All values in the Value column are referenced by names derived from the Parameter column. The formulas are:

  • LogMean represents $\mu$: =LN(Mean) - LogSD^2/2

  • LogSD: represents $\sigma$: =LN(1 + SD^2/Mean^2).

  • LogMin is the logarithm of the left endpoint of the truncation interval: =LN(Min)

  • LogMax is the logarithm of the right endpoint of the truncation interval: =LN(Max)

  • qMin is $a$, the lower limit of the quantile $U$: =NORMSDIST((LogMin - LogMean)/LogSD)

  • qMax is $b$, the upper limit of $U$: =NORMSDIST((LogMax-LogMean)/LogSD)

  • DeltaQ is $b-a$ for the calculation of $U$: =qMax-qMin.

The entries in columns A:C are each obtained by a formula entered at the first row and copied down:

  • Uniform RN represents $U$, computed as =qMin + DeltaQ*RAND().

  • Y are the logarithms of the random values, computed as =LogMean + LogSD * NORMSINV(A2) et seq.

  • X is obtained by exponentiating Y: =EXP(B2), et seq.

whuber
  • 281,159
  • 54
  • 637
  • 1,101
  • 1
    Nice answer. I was trying to pin down the OP, but your answer will serve much better. As an aside, Excel 2010 is much better, but I've still written my own VBA code for gammaln and other needed functions, and, of course, use R as often as I can. – Avraham Jun 17 '14 at 14:51
  • Thank you so much @whuber. I can hardly understand the mathematical notation, but I want to fully understand the process. I understand the limitations of excel, but it is easier for me to develop the process in my excel UNTIL i understand the logic and steps well. Then move on to another software. i edited my question detailing what i have until now. – Vince Jun 17 '14 at 18:31
  • Based on your edits, it is now clear you have already taken the first step of analyzing the logarithms of your data. Therefore you do not need to begin with `Mean`, `SD`, `Min`, and `Max`. Instead, just directly input the values of `LogMean`, `LogSD`, `LogMin`, and `LogMax`. This leaves very few formulas to enter: only `qMin`, `qMax`, and `DeltaQ` are needed to set up the random number generation performed in columns `A:C`. For Monte-Carlo simulation those columns can be combined into a single formula `Exp(LogMean + LogSD * NORMSINV(qMin + DeltaQ*RAND()))`. – whuber Jun 17 '14 at 19:39
  • Thanks @whuber, i am going to edit my post following your guidelines, i need some time. – Vince Jun 18 '14 at 05:47
  • works great @whuber with the positive side, just extracting positive numbers of my original dataset and then computing parameters from them. But how can i deal with negatives values?. – Vince Jun 19 '14 at 08:59
  • You cannot deal with negative values using a lognormal distribution, Vince, because it can only describe positive distributions of numbers. I cannot advise you further because I have no information about why you are doing this or what you are trying to achieve. Consider asking a new question in which you describe your data and what you need to accomplish with your analysis. – whuber Jun 19 '14 at 13:15
  • Yes @whuber, i was think about that just right now, i am mixing things, i'll try to ask a new question and define what are my aims. I learned here how to truncate a lognormal distribution without using LOGNORM.INV, thanks again. – Vince Jun 19 '14 at 14:12
  • More sophisticated methods to generate data from truncated distributions are explained at http://stats.stackexchange.com/questions/19736/what-does-truncated-distribution-mean. (I elected not to go into such details due to the need to suggest methods that could easily be implemented in Excel.) Some of these methods would have to used in special cases, such as truncation of all but the extreme tail of a distribution, because then the inaccuracies (or even just the imprecision) of the quantile functions like `NORMSINV` can create large errors. – whuber Jun 22 '14 at 14:58